Maintain Profits in the Housing Index (HGX)

OK, it may be time to hold your nose and smile, considering the nice gain we’ve had since I recommended this investment.    Smile but preserve your profits. Resistance is far from us date-wise at 116.81, the high way back on 9-17-2009. But the market may respect that, so if you see it pull off that number and turn down, you may want to exit the position.   You can always rebuy higher if it goes straight on up.

Here is where the current support is:

KEY TO CHART (courtesy of Worden Brothers, Inc. at FreeStockCharts.com):

RED LINE: Nearest support representing last breakout point.

BLUE LINES: Two prior breakout points that could provide support on the way down.

WHITE LINE: The up trend line that could also provide support.

CONCLUSION: The index has had a nice little run with 3 identifiable breakouts.    Preserve your profits by either selling around here or slightly higher (doubt we’ll see that today but you never know) OR you can sell using a stop below here.    The gains from today are already fading and the overall stock market is a bit weak, so we’ve likely seen the high for the day.

By the way, my SP500 tracking newsletter is out this weekend and its FREE, so please subscribe below if you are concerned about where the stock market may go from here:

Click Here to Subscribe to my FREE SP500Tracker™ and free “Tips”

The charts were produced by FreeStockCharts.com which is a registered trademark of Worden Brothers, Inc., Five Oaks Office Park, 4905 Pine Cone Drive, Durham, NC 27707. Ph. (800) 776-4940 or (919) 408-0542. http://www.Worden.com.

Standard Disclaimer: Remember, it’s your money and your decision as to how to invest it.

Posted in Uncategorized | Tagged , , , | Leave a comment

Gold Is Going to Make Up Its Mind: Here are the Market Timing Parameters

Gold as represented by the GLD in the chart below has closed below the 50 day moving average, which excites the Bears. Although gold could simply continue down here, we have to askwhat could support a rally on a technical basis?

Have a look at the chart courtesy of Worden Brothers, Inc. at FreeStockCharts.com:
 

KEY TO CHART (from top to bottom):

GREEN LINE: Resistance at last high.

RED LINE: Immediate resistance above the current price represented by both the up trend line in WHITE as well as the 50 day moving average in YELLOW.

YELLOW LINE: 50 day moving average

WHITE LINE: Up trend line

BLUE LINES: 1st is current consolidation support line and 2nd is a deeper level of support represented by a prior low.

CONCLUSION: GLD is going to move out of the consolidation range bounded by the RED and highest BLUE line in the chart. When it does, you’ll likely see a clear move either UP or DOWN. Note that the 50 day moving average and the up trend line are pretty much coinciding right now. A close above those would be BULLISH.

The likely target of an UP move would be the last highs while a DOWN move would take us to at least 130.13, which is the lowest blue line on the chart.

My next FREE issue of the SP500 tracking newsletter will be out by the end of the weekend. Sign up using the link:

Subscribe to my FREE SP500Tracker™ and free “Tips”

The charts were produced by FreeStockCharts.com which is a registered trademark of Worden Brothers, Inc., Five Oaks Office Park, 4905 Pine Cone Drive, Durham, NC 27707. Ph. (800) 776-4940 or (919) 408-0542. http://www.Worden.com.

Standard Disclaimer: Remember, it’s your money and your decision as to how to invest it.

Posted in Uncategorized | Tagged , , , , | Leave a comment

Don’t Buy More Gold Yet: Here’s why

Gold has bounced off of support represented this time around by the 50 day moving average and it now approaching the prior highs. Actually today, it’s pulling back a bit as the US dollar strengthens slightly. The chart below shows you where to pull the trigger on your next buy:

Gold ETF GLD Market Timing Chart

Here is the key to the chart:

Green line: Breakout point.

Red line: First support represented by the gap that occurred there (space between the 12-27-2010 and the 12-28-2010 prices).

Blue lines: Lower support levels that could be reached in a more substantial pullback.

White line: Up trend line of support.

If we do NOT break up and out over the green line of resistance, the gold market will pull back to any one of the support levels shown in the chart. The gap would be the first target, followed by the RED line, the WHITE up trend line, and then the two blue (OK aqua!) lines. There are other support levels of course below these, but this gives you some of the possible targets for the next pullback should we see it.

CONCLUSION: For now, BUY the next close over the green line which is at 139.54. You can buy the IAU instead if you like as it has lower carrying costs. The only limitation is liquidity and the absence of many options choices although that should change going forward. My choice is to use a tight stop (see my website “Buyers Checklist” page for an explanation of stops) on all new purchases, and I do not believe in trading your long term position as it would be like trading out of all your US dollars. You could do that, but most investors would not. Also, gold acts as a hedge against fiat currency issues as I’ve discussed before.

Click Here to Subscribe to my FREE SP500Tracker™ and free “Tips”

Standard Disclaimer: Remember, it’s your money and your decision as to how to invest it.

Posted in Uncategorized | Tagged , , , , | 1 Comment

Golden Advice About Owning Gold and Silver

I believe investors think about gold and silver in a way that does not fully recognize both RISKS and BENEFITS. Let’s look at TWO commonly held beliefs about buying gold and silver.

BELIEF 1: Gold is a store of value. If you buy it, you have achieved greater safety.

This is true to an extent. Yet gold went from about $850 per oz. at the end of the ’70’s inflation scare down to $296.75 (London PM fix). Gold then reached a new low of $254.20 during the Clinton years of dollar strength. So was it a hold of value considering inflation? Not really and the same is true for silver as I’ll go over in the next section. You certainly did not lose ALL your money as you can in some stocks, but you did very poorly if you bought at the peak.

Gold touched down second time at 256.25 on 2-20-2001 and then rose, and rose, and rose.

I recommended that investors buy gold at $332/oz during the breakout above the prior 2002 highs. I have never advocated selling long-term positions, but have recommended trading in and out with a portion of your assets if you so choose.

On November 9th, 2010 gold hit its ALL TIME high of 1421.00 and since has drifted down a bit to around $1400 per oz. But will it continue higher? The next “belief” suggests that it could go higher. A lot higher.

BELIEF 2: Gold is a hedge against fiat currency printing, but this could never happen to us.

Gold does serve this protective purpose. While currencies can go to near zero as they have in various countries since the beginning of time, gold does not go to zero. They even point this out on commercials written by gold sellers. Sometimes commercials are TRUE. At least they give you the part of the truth that serves their interest.

The way our Fed is printing money, many are advising that you hold anywhere from 5 to 20% of your assets in gold and silver. That way, if there is even moderate inflation of say 25%, you will at least partially hedge against it. If there is hyperinflation, owning precious metals can save your ability to pay your bills. Is that likely? Some say it is inevitable given the course we are on. Some say this is overblown.

The evidence that I find most compelling that you need to protect yourself against a currency crisis is

  • the decrease in Chinese US dollar reserves over the past few months
  • the talk by the oil-producing countries of creating an alternative to US dollar investment
  • a publication by the IMF (International Monetary Fund) that said a “world currency” should be created.
  • There are other signs and symptoms of a pending currency crisis in the US, but there have been for years, whereas I take what China, Russia, and the Arab nations are talking about and are now DOING much more seriously. China HAS dropped its holding of US Treasuries over the past few months.

    My point is to not get caught unprepared. Owning even just 5% of your assets in metals will not kill you if it drops to half of what you paid for it. Jim Cramer recently recommended holding 20% in gold. He holds gold via gold stocks in his own accounts due to restrictions on what he can invest in. Buy a basket of gold stocks (an ETF or mutual fund; ETF’s are cheaper usually) for your “gold stock” portion of your gold holdings is my opinion. Owning both gold and silver may be a reasonable thing to do. How much you own and how you own it can be found on the web. And of course, discuss it with your financial advisor.

    Silver carries economic risk with it. That means silver COULD drop by 50% again, because it is linked to the economy unlike gold. Silver crashed during the 2008; it did NOT rally. The SLV fell from $20.73 to a low of $8.45 and then rebounded to around $30 currently. If you panicked out you LOST big money. If you stuck with it, you have “made” big money and some say that you’ll make even more in silver vs. gold going forward if the currency crisis deepens.

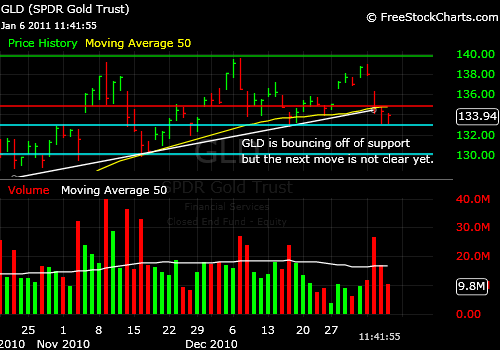
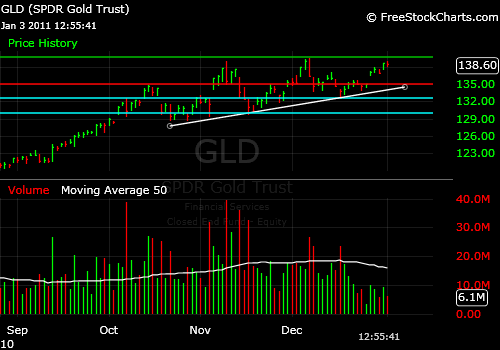
    Realize that trading metals with a portion of your holdings is often more lucrative than holding them. And you don’t have to jump in and out over short periods of time. I follow gold in my newsletter via the GLD.

    Click Here to Subscribe to my FREE SP500Tracker™ and free “Tips”

    Standard Disclaimer: Remember, it’s your money and your decision as to how to invest it.

    Posted in Uncategorized | Tagged , , , , | 1 Comment

    Philly Housing Index Breakout

    Just Tweeted that we had a buy last night at the close of the HGX index. Housing is one of those “stinkers” that may make you money. The stinkers are rallying, so buy in scale but do hold your nose and buy is my take on it.

    Enjoy your day.

    David

    Standard Disclaimer: Remember, it’s your money and your decision as to how to invest it.

    Posted in Uncategorized | Tagged , , , | Leave a comment

    The SP500 Index is at a Decision Point

    I wrote in my current FREE SP500Tracker™ newsletter that the SP500 has not yet resolved the upward wedge market timing SELL signal either way. The “lid” is at 1246.73 and the bottom through which trouble would lurk is at 1227.08. You can obtain quick access to the current issue and see the current chart set-up by subscribing here:

    Click Here to Subscribe to my FREE SP500Tracker™ and free “Tips”

    Standard Disclaimer: Remember, it’s your money and your decision as to how to invest it.

    Posted in Uncategorized | Tagged , , , , | Leave a comment

    The SP500 Wedge Break Signal has NOT been reversed….not YET

    The close today at 1242.87 for the SP500 brings us to a point that is still below the high for yesterday. That is not enough to void the market timing sell signal from yesterday. What that would take would be a close AT LEAST above yesterday’s high if not a fresh new high above 1246.73. Until that happens, the sell signal I discussed over the weekend and last night is still an issue for the SP500.

    Have a good one (have to stay “generic” in my closing because it’s the am for my Australian and Chinese readers and night for us on the Suncoast of Florida!),

    David

    P.S. Don’t feel too bad. It’s only 55 degrees F here tonight!

    Standard Disclaimer: Remember, it’s your money and your decision as to how to invest it.

    Posted in Uncategorized | Tagged , , , | Leave a comment

    Gold Broke Its Shoulder

    Gold broke its shoulder yesterday, BUT it has not yet broken the base of the head and shoulders formation that has formed. Awwww poor gold. When I say it broke “its shoulder,” I mean that the GLD gold ETF traded below 134.85, which was the top of the left shoulder in October. That means the next logical target is around 130 or the base of the head and shoulders formation based on market timing analysis.

    And what if that breaks? Then GLD goes down by the price distance from the high to the base of the formation. You then subtract that value from the price at the base where it breaks and you have the target of about 121.29 which is now about where the 200 day moving average is located. That would be the target ONLY if the base of the head and shoulders was broken.

    5:40 pm Addendum: Where Gold ended today says it could bounce from here. It is sitting just above the 50 day moving average that is often watched by investors. If it closes back below there (it did fall below there today and then recovered), there will be another leg down. Breaking back below the left shoulder was just the first step. It must now slice through the support that this moving average provided today.

    If you decide to take a new trading position, you may want to dump that new position if GLD closes back below that support or approximately below 133.64. We closed at just 133.81 and in the after hours market GLD has declined to 133.74.

    Enjoy your day.

    David

    Standard Disclaimer: Remember, it’s your money and your decision as to how to invest it.

    Posted in Uncategorized | Tagged , , , , | Leave a comment

    SP500 Signal Just Went Off

    The SP500 index wedge has been broken to the downside. When a wedge is broken to the downside, the particular index can retrace to the base of the wedge which would be at about the November lows. This is the nature of this market timing signal.

    When a signal like this goes off, you have a few options:

    1. Set a stop loss somewhere below the current price, but fairly close.

    2. Sell here and rebuy a new recent high close.

    3. You could even use a very wide trailing stop at 15%-25% below the high if that is your style.

    For the charts on what this wedge looks like see my FREE SP500Tracker™ newsletter which was out early Monday morning.

    You can sign up here:

    Click Here to Subscribe to my FREE SP500Tracker™ and free “Tips”

    Enjoy your day!

    David

    Standard Disclaimer: Remember, it’s your money and your decision as to how to invest it.

    Posted in Uncategorized | Tagged , , | Leave a comment

    The SP500 Index Has Prevailed: How Not to Be Run Over by a Market Maker

    So far so good. The SP500 has prevailed in that it has closed back above “my number” that I pointed out a couple of days ago when the market was stalling (see prior posts to the right).

    So what was the pullback all about? The answer is that the market often pulls back to prices that investors feel are critical. It’s called a retest. A retest can be passed or failed just like..well, a test of any kind!

    In this case, the market makers made nice money off what they love to call “the weak hands” that ditch their shares the moment potential trouble shows up. They take their money and then move the market back up enough to get the Bulls to bite again and the Bulls then buy back all the shares they just bought cheap and the market maker goes home happy with lots of money!

    That is why you have to be careful about where you set your stops. If you set a stop in the market, they know where everyone is piling up, so it’s best NOT to put in an order for a particular stop if you can avoid it. They sometimes will see a bunch of sellers at say 10 cents below where the market is. All they have to do is sell into that and a whole bunch of stops start to go off. Then they buy back enough shares to entice the Bulls as I just mentioned and the bounce makes them money.

    The survival of the SP500 restest means the rally is intact so far. There is a problem for the rally in the near term though. That is in sentiment. I published the AAII number summary and analysis this morning. Simply go to the “Read My Feed” button at SunAndStorm.com to read that entry; it’s the second one down. It’s important, because we could give up the gains accrued over the next days to weeks and end right back HERE!

    One more thing. My FREE SP500Tracker™ newsletter will be out by Sunday evening. Don’t miss it.

    Click Here to Subscribe to my FREE SP500Tracker™ and free “Tips”

    Enjoy your day!

    David

    Standard Disclaimer: Remember, it’s your money and your decision as to how to invest it.

    Posted in Uncategorized | Leave a comment