
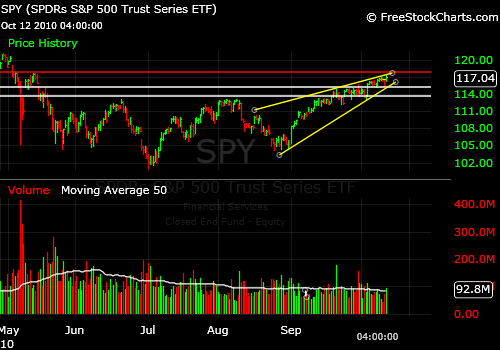
The wedge is formed by the two YELLOW lines converging toward the upper right on the chart (see below).
The two WHITE lines represent resistance levels the market has been able to successfully trade through to the upside.
The RED line indicates the next level of resistance at the May high prior to the “Flash Crash” of May 6, 2010. The SP500 must trade up through that level or it risks forming a lower high than the April high and coming down.
Here it is courtesy of FreeStockCharts.com by Worden Brothers, Inc.:
So what can happen?
The SP500 can trade up through the May high and break up through the top line forming the wedge and thereby negate the effect of the wedge
OR
it can fall back through the lower line forming the wedge and go as far as the “origin” of the wedge which would be the August low.
If the market were to break down from here, it would be supported at least briefly by the two price points indicated by the horizontal white lines.
CONCLUSION: The SP500 has broken out above significant resistance levels, but is close to overhead resistance at the May high. Getting through the may high would likely bring the market back to the April high. Falling through the base of the wedge could bring the market as low as the August low.
Standard Disclaimer: Remember, it’s your money and your decision as to how to invest it.
You can review the POSITIVES AND NEGATIVE SIGNALS in the markets HERE (from today):
Market Timing Blog at SunAndStormInvesting.com
Click here to get my “Tips” for FREE
The charts were produced by FreeStockCharts.com which is a registered trademark of Worden Brothers, Inc., Five Oaks Office Park, 4905 Pine Cone Drive, Durham, NC 27707. Ph. (800) 776-4940 or (919) 408-0542. http://www.Worden.com.
