A Market Timing Report based on the 2-08-2013 Close published Sunday February 10th, 2012
UPDATE 2-13-2013 @ 10:15 pm: This is an update of my 2013 prediction on banking stocks. They’ve continued to do well. Biotechs (BTK) and drug stocks (DRG) have done OK too. Oil stocks (XOI) have zoomed past the Sept. high. EWC (Canada) is down a bit and EWA (Australia) has moved up while VWO did correct slightly as anticipated but is regaining some strength. Note that all of those are unhedged against the US dollar (The US dollar index is up 0.7%, since the 1-11 close that preceded my report). Here is the banking index chart:
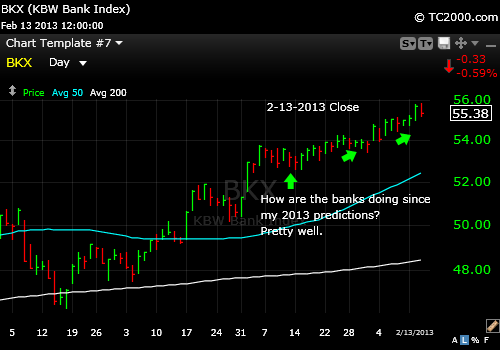
Market timing the banking index (BKX) since my 1-13-13 prediction.
UPDATE 2-12-2013 at 1:18 pm: Note that the GLD chart is the second chart below. The following chart I’ll call “Oops I Bought All of the Same Thing!” shows that if you plot mid caps (MID,MDY) vs. the SP500 (in yellow, SPX, SPY) vs. Russell 2000 Small Caps (red line on chart; RUT, IWM), they have all done the same since the August low. I went back to the March 2009 bottom and found the same result. Sometimes when we diversify in name, there is no true diversification, so please look at these comparison charts for what you own and avoid buying assets that all move together in lock-step.
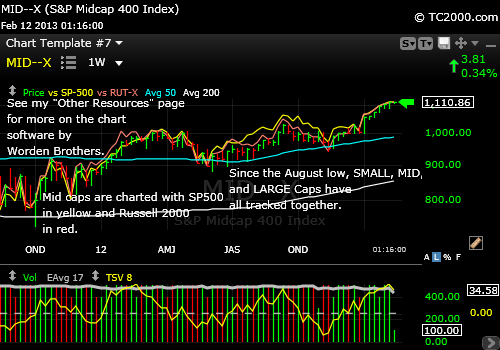
US Stocks of all classes have been fully correlated for a long time, even since the 2009 low!
UPDATE 2-11-2013 after the close: GLD had the proverbial bad day. Compare my prediction to the change in today’s chart. The January or December low will be next. The green arrow points at the triangle. The close was at 159.70.
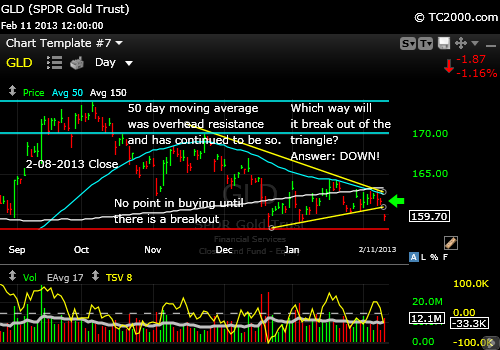
Gold falls through the base of the triangle.
And now for this week’s issue…
The market is making more progress with investor sentiment getting worse, not better. That is a positive sign for the Bulls as it allows for more upside. According to the American Association of Individual Investors (AAII survey), the Bulls were down about 5% to 42.77% and the Bears up about 5% to 29.56%. The same number of investors as last week were undecided at about 28%. The Bull-Bear Spread was 13.2% down from 23.7%. Those numbers say to me that there is room to rally still.
The VIX was back down below the critical 13.30 number I spoke of last week. That means there is still an opportunity for lower lows in the volatility index (i.e., the SP500 can rally). Fear is declining as the market is going up, which is Bullish, especially the drop below 13.30 in the context of a strong market rally.
The chart this week shows the latest market timing breakout of the SP500. Find it here: Market Timing Charts for Sunday’s Issue (opens separate window so you can access all the charts)
The SP500 (SPX, SPY) breakout is just in the first day. My first target is now higher than the earlier 1525 at 1564, but given the fact that the 2007 high is fairly close at 1576.09, I’d say we could retop in one move. It is only 3.83% higher. Is it a time to add to your positions? Only if you plan to trade them. The longer term move looks exactly like the move from 2002 to 2007. You realize what happened after that? Will it be different this time for “Rally 2.0”? It could, but only if the world economy starts moving again.
The intense insider selling that has been in the press is a concern, but as in any relationship, if you get out too soon (prior to market death), you may be missing out on a lot. There are always excuses we can find to run and to live life on the investment sidelines. When you are spooked out too early, you lose. The way you live your life is likely the way you’ll run your investments and vice versa. Take a look at that, and it will save you from many mistakes in life and in investing. There’s more on my “Fear and Greed” page if you’ve never seen it (on the main site SunAndStormInvesting.com).
Even the small caps (RUT, IWM, IWO, IWN) are still climbing. I had thought that they were at least somewhat ahead of the large caps at this point from the November low, but the charts surprised me when I ran the comparison as shown in the Bonus Chart of the Week (see the above link).
The small caps barely broke out on Friday, so the jury is still out on the latest move up. The risk of a pullback is of course higher the higher valuations go, but we’ve learned repeatedly over the years that markets do not stop moving up or down based solely on valuation. The leadership of the market is definitely narrowing in some areas like housing, health care, and oil stocks. Those three markets are correcting while the SP500 rallies. The NASDAQ 100 Tech Index (NDX, QQQ) also rallied this week as I’ve been saying it would. I am not entirely happy with the gap up in large tech, since the last gap up did not endure, but it was a breakout, and I did add to my position.
Emerging markets have been soft over the past week (VWO, EEM). India is in correction. China is also soft. Still, VWO showed a bit of strength Friday, so the correction could stop here for VWO.
The CRB index softened this week and so did gold. Agricultural products got cheaper (DBA). They have been falling since September. GLD is caught in a triangle and I recommend following the break up or down OUT of the triangle. It will likely define a significant move. I feel we should demand at least a move up by the gold ETF above the upper portion of the triangle before putting more money to work in it. Have a look at the chart (see link above).
Another quick note for highly taxed investors: Munis have found some support. I’m going to add a bit on Monday unless PZA breaks support.
Standard Disclaimer: It’s your money and your decision as to how to invest it.
The above is the text from this week’s free report. To receive future reports ahead of publication of the text shown above AND much more market timing information, please subscribe for free here:
Free Subscription to My Weekly Newsletter
If you “liked” this post, would you please “Like” it at the “Share” arrow below? Thanks very much!
And to follow my Buys and Sells and up to the minute insights, please follow and bookmark my Twitter feed here: Join Me on Twitter
All charts are courtesy of Worden Brothers. Please see my “Other Resources” page at SunAndStorm.com if you would like to learn more. I’ve used their software
Copyright © 2013 By Wall Street Sun and Storm Report, LLC All rights reserved.
