A Market Timing Report based on the 6-28-2013 Close published Sunday June 30, 2013
There’s just “one thing.” That’s the line from City Slickers right? Well at this juncture in the market, and it’s impacting EVERY market around the world, the one thing that matters most is the interest rate on the U.S. 10 Year Treasury (TNX). You can follow it using the symbol TNX. And if you want to play it more directly, TLT and TBT are the ETFs that most traders appear to favor. But the reason it’s so important is that stocks and bonds are valued relative to one another. When rates are low, investors favor stocks, so when the Federal Reserve even HINTED at less monetary easing, first by pulling back on Quantitative Easing perhaps starting as early as September, the markets panicked.
I was fooled by the bump up in the market on Tues. 6-18-2013 the day prior to the Fed announcement. I felt that the market would not have broken above resistance on the chart at 1649.69, which represents the 6-10-2013 high, if the Fed were not going to “soothe” the market appropriately. That turned out to be wrong. The Fed scared the market into higher interest rates until it started to re-educate the market this week saying that the markets had reacted inappropriately. It has been rare in the past that the Fed would ever comment on the precise level of interest rates, so they must have been concerned.
They should have been concerned! What it meant to have interest rates soar to above the 2.397 – 2.407 (prior TNX highs), is that the bond market was suddenly IGNORING the Fed’s comments, while it’s been held in line more or less since 2009. In other words, it was a sign of a lack of trust in the Fed to do its job in keeping interest rates low enough to allow the recovery of the economy to proceed.
That is why the current beginning of a stock market rally, which is coinciding with rates falling from the recent high, may continue. Rates need to keep falling. Otherwise, the Fed has ZERO credibility with the bond market, and the bond market is going to take this Fed by the nose and lead it as it used to do when the “Old Normal” was operative.
So what do I expect? I expect Fed action along with more Japan and China buying (per Bond King Bill Gross’ rumor sources, they started helping the Fed again) to sustain this Treasury market rally from the recent high in yields to the 2.0 to 2.2% level, the latter chosen as the “preferred level” by Bill Gross. I think Bill will be right this time, although he’s been wrong at times during the past year, because the Fed’s reputation is at stake. If the Fed loses this, they risk undermining all the progress they’ve made to date. And the stock market will sell off and quickly reach that 1494 target I mentioned last month. But if rates continue easing off now, we could have seen a temporary low in the stock AND bond markets. That’s why I picked up a couple of muni bonds at the end of the week. Not great buys perhaps, but OK on a relative basis. I stuck with 5 year maturities.
Take a look at the current SP500 Index “Tracker” Chart via the main chart link here: Charts for Sunday’s Issue (opens separate window with all charts) And the 10 Year Treasure Chart is at the same link on the prior Bonus Chart page.
If you want to get an even better feel for what was going on last week, see my private trading notes on the WSSSR Access page at the top just under the WSSSR issues (get the password first by signing up for the newsletter below): http://www.sunandstorminvesting.com/market-timing-tips.html
If you prefer the broad strokes, continue reading here.
What I did last week was to re-enter both the US (SPY, SPX) and Japanese (DXJ) stock markets as the 10 Year Treasury yield fell. Those positions are still in the green.
I also entered ITB as a proxy for HGX housing stocks, which it tracks fairly well. ITB was very weak on Friday, erasing the gains from the prior day, so it’s a bit more toward neutral until it rises back above 22.75. My ITB position is slightly in the red after that pullback. Note that while HGX is slightly below the 200 day moving average, ITB is slightly above it. But they both survived the last retest. A second failure at the red line and certainly at the recent low will not likely be taken well (as it wasn’t for gold either!). This trade is at the very center of the Fed adjustments so consider it a higher risk trade.
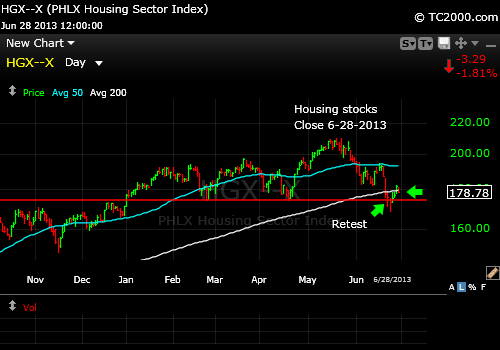
Housing Stocks bouncing from support.
I will continue to add exposure to U.S. stocks, Japanese stocks, and U.S. housing particularly if:
1. Treasuries continue to fall in yield.
2. The SP500 Index confirms the move.
Last month I warned that there was nothing very promising about gold. We closed our trading position much higher. Gold was pummeled again and again over the past month and I commented on the chart here where the chart has been updated: http://wp.me/p14gPd-zk Gold has a lot of room to rise from the latest low and Bears are probably due a licking to remove some of their pride. The problem with gold as an investment here is that it could rise to the 50 day moving average and continue to fall again. We won’t know until we get there.
I’d say that if you own no gold, this might be an averaging in spot, but THERE IS NO TECHNICAL BUY SIGNAL. Here’s the scoop though: If I’m right about rates, real interest rates are now going to fall again and gold will rise. That is the sole reason gold perked up on Friday from it’s most recent near death experience. Personally, I’ll be selling more at lower prices (if we see them) to preserve profits.
What else could make gold (GLD) rise further? The Fed, because it has never been able to take us out of recessions without stimulating some inflation. Inflation is the only other thing that can cause a huge gold rally assuming we don’t go into another slump where the Fed is still buying debt en mass. And guess what? There has clearly been some food and oil inflation since the lows in oil prices a few years ago, but other pricing besides housing has been fairly stable. So inflation is not a problem yet.
If the Fed actually pull off what it would like to and end it’s QE and easy money policies without inflation, gold may be well below $1000/oz. If the TNX continues to make new highs, gold will plummet another notch. I doubt that, but never say never in trading and investing. Protecting profits is smarter. The most conservative way to play gold would be to buy it in steps but then sell if it closes below a certain stop for each new position. That way, you can preserve profits on earlier positions and avoid big losses on your capital. I would not buy without stops personally. Some do and call it insurance, but your insurance may lose value. No one can tell you what gold is really worth although some say $1200 is the marginal cost of production. Below there, mines will shut down is the claim so gold prices will stabilize higher. So gold may have reached a temporary low based on both interest rates and reaching the approximate cost of production.
Remember that there are limits on the Fed here. They don’t want to overdo their buying of debt. The reason they’ll act here is not to drive rates back to the prior lows, which would help gold in a major way; it’s to stabilize rates at a workable level. They don’t need gold to be at $1900. The housing market has heated up enough that gently rising rates will lead to higher home prices as they have in past cycles. If rates get out of control, housing would be crushed again, but that is not likely in the near future (at least for a couple of years perhaps). The Fed does not have to buy mortgages in the market when the housing market is doing well. That’s why they are shutting down QE starting in September most likely (that’s the date the market “likes”). Fed funds rates won’t rise for much longer, but it was QE and direct Treasury buying that had the big impact on rates.
One caution sign on gold: Commodities (CRB index; DJP) hit a new recent low on Friday. No inflation there! And it implies a weak world economy, bad for price earnings ratios. Earnings are coming up and could throw a wrench into the market, not this Monday, but the next when Alcoa reports.
This week, if rates don’t keep falling, I’ll likely be kicked back to the sidelines on all recent stock market buys. If the retest Friday was enough, things will work out better. Where to exit this swing will be the next issue. When volatility rises as it has, if you are not trading the market, you are probably not going to do as well and it’s not easy to catch every swing correctly. Staying on the sidelines until the air clears is another way to handle it, if you prefer not to trade. I would have protective stops on all profits though, as you never know how low we’ll go. If you sell, you must be willing to re-enter if your exit point is proven wrong.
But this weekly chart says rates may have just peaked. See the prior failures? We’re now POTENTIALLY failing at a similar chart point:
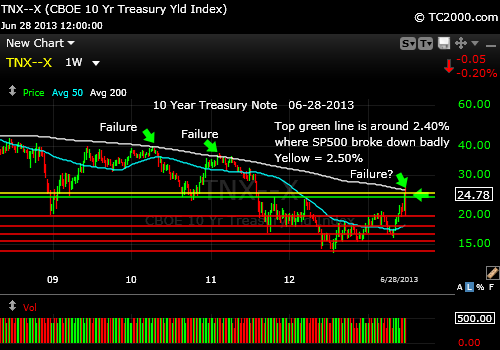
Another failure of rates to rise above the 200 day moving average?
My pessimistic target so to speak based on a rate failure is at 1494 for the SP500 Index, 7% below here.
What about the immediate future for U.S. Stocks? Check out the Sp500 Index chart at the link above as I give you the details.
We’ve already tested and failed initially at the 50 day moving average. Yes, sometimes obvious technical points work, but at other times rallies slice right through the 50 day moving average to the upside. That failure might have marked the end of this swing, but due to the fall in rates, I don’t believe that will be the case. That is my thesis, right or wrong. Decide for yourself. What it means is that if you bought on this swing, it’s not a sell yet, but if you have not bought, it’s not a buy yet. That’s call a HOLD! ; )
When I reviewed prior retracements from failures at the 50 day mav, I found that they ranged from about 30-70% of the prior swing up, and 70% is a lot to give up I realize. Then they swing up through the 50 day moving average very often. My trading will depend on rates. I may start to exit a swing lower in stocks if rates rise above 2.5% in a meaningful way. If rates hold up well, I’ll probably just sit tight. Decide on your own stops of course. I’ll tweet when I issue any market timing notes during the day. Those will be posted on the subscribers only page.
The VIX and investor sentiment don’t help much this week. Both could fall or rise and are in neutral positions.
And here is why I like Japan, particularly the currency hedged ETF, DXJ:
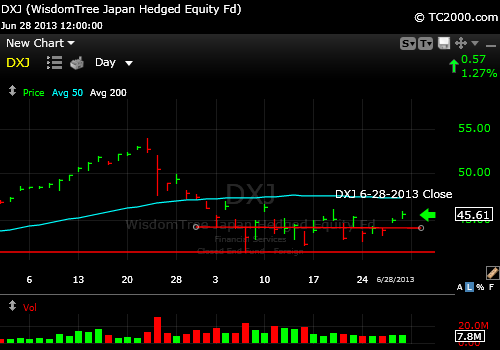
Hedged Japanese Equity fund (if yen goes down, it does not effect the value directly).
There seems to be support building with higher lows and a nice base. If the base fails, you won’t want to stick around, but as I said when Japan was falling, it’s unlikely that the swing up in Japan will just be one big move. I think this is the second move up that we’re about to see. But it has not happened yet beyond the upward tone you see.
One month ago I wrote: “It may be worth buying such a pullback this time provided the 10 Year rate is contained at 2.4%.” I believe we’re now going to reverse back below that level to lower rates, which would support a further rally in stocks. So the TNX is an important number to watch. All of my recent buys will work out if rates continue falling.
Have a great week investing and/or trading!
Note: The long term signals have been updated in this week’s issue (subscribe below).
Standard Disclaimer: It’s your money and your decision as to how to invest it.
Follow me on Twitter here: Follow Me on Twitter
I thank Worden Brothers for the chart system I use to post these charts. If you want to know more about the charting system I use every day, go to my “Other Resources” page here: Other Resources It makes it much easier to follow along with me if you can see the charts and manipulate them on your own computer, so it’s a great investment to have an excellent charting system.
To receive future reports and reminders that charts are ready to be viewed, subscribe for free here:
Free Subscription to My Newsletter
The next full issue will be out on Sunday, 6-30-2013 for free subscribers. Look for updates on the main chart tracking pages this week as I feel they are needed and comments via Twitter.
Copyright © 2013 By Wall Street Sun and Storm Report, LLC All rights reserved.
