A Market Timing Report based on the 10-18-2013 Close published Sunday October 20, 2013
The SP500 Index has made yet another all time high. I cover my thoughts on this chart along with gold and interest rates in the notes on my access page. You can subscribe here: Free Subscription to My Newsletter
Here’s the chart:
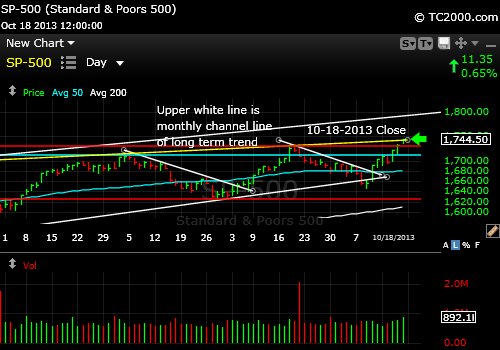
New SP500 Highs
Standard Disclaimer: It’s your money and your decision as to how to invest it.
Follow me on Twitter here: Follow Me on Twitter
I thank Worden Brothers for the chart system I use to post these charts. If you want to know more about the charting system I use every day, go to my “Other Resources” page here: Other Resources It makes it much easier to follow along with me if you can see the charts and manipulate them on your own computer, so it’s a great investment to have an excellent charting system.
Look for updates on the main chart tracking pages this week as I feel they are needed and comments via Twitter.
Copyright © 2013 By Wall Street Sun and Storm Report, LLC All rights reserved.
