A Market Timing Report based on the 10-25-2013 Close published Sunday October 27, 2013
GLD (now @ 130.46) has made it through 2 of the 3 resistance points shown in the chart, including the yellow down trend line and the 50 day moving average, but the 4-15-2013 Tax Day point low of 130.51 remains at the aqua resistance line in the chart below. If interest rates rise from here, gold will be under pressure with the rest of the metals, so be sure to review this week’s 10 Year Treasury Chart (link to upper right). And to keep up with my latest thoughts on my access page, you’ll need the password, which you can get here:
Free Subscription to My Newsletter
Here’s the chart:
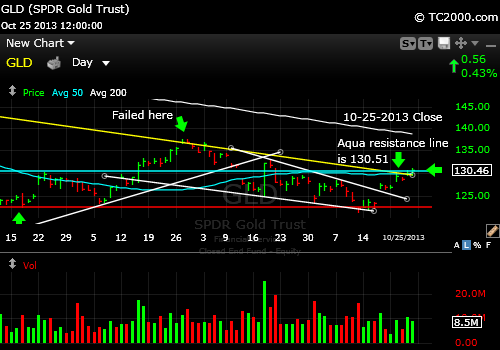
GLD meeting immediate resistance, but has made progress
Standard Disclaimer: It’s your money and your decision as to how to invest it.
I thank Worden Brothers for the chart system I use to post these charts. If you want to know more about the charting system I use every day, go to my “Other Resources” page here: Other Resources It makes it much easier to follow along with me if you can see the charts and manipulate them on your own computer, so it’s a great investment to have an excellent charting system.
Look for updates on the main chart tracking pages this week as I feel they are needed and comments via Twitter.
Copyright © 2013 By Wall Street Sun and Storm Report, LLC All rights reserved.
