A Market Timing Report based on the 11-29-2013 Close published Sunday December 1, 2013
The 10 Year Treasury yield playing with a specific number on the chart and that is the 10-16-13 yield high of 2.757%. Above there and rates are technically rising and below there, which we are at the moment, rates certainly have a chance to fall. After all Santa Ben is there with his big bag of US dollars. A QE taper in December would shock the markets by the way, if you are looking for a reason for a sharp correction in stocks.
The chart below will determine the direction of gold in the near future (see gold chart link to the upper right).
Here is the interest rate chart for the 10 Year Treasury Note:
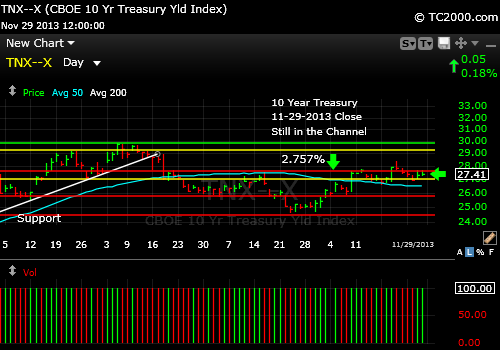
Rates on the cusp. The number to follow is 2.757% for the next few days.
Please keep up with my latest thoughts about the markets on the access page on the main website. Get the password here: Free Subscription to My Newsletter
Standard Disclaimer: It’s your money and your decision as to how to invest it.
Follow me on Twitter here: Follow Me on Twitter
I thank Worden Brothers for the chart system I use to post these charts. If you want to know more about the charting system I use every day, go to my “Other Resources” page here: Other Resources It makes it much easier to follow along with me if you can see the charts and manipulate them on your own computer, so it’s a great investment to have an excellent charting system.
Look for updates on the main chart tracking pages this week as I feel they are needed and comments via Twitter.
Copyright © 2013 By Wall Street Sun and Storm Report, LLC All rights reserved.
