A Market Timing Report based on the 12-20-2013 Close published Sunday December 22nd, 2013
The 10 Year Treasury yield tested the prior high in the 3% area after the Fed announcement that their dollar busting Quantitative Easing program will be scaled back by 10 billion of the current 85 billion US dollars in January. Few expected it. It does displace the full blame for the “QE Taper” from the incoming Chair of the Fed, Dr. Janet Yellen.
This caused rates to rise to test the 3% area, but by Friday they were back down near the Weds. close the day of the Fed announcement. The Fed did taper QE, yes, but not dramatically, so rates could still experience enough downward pressure to satisfy the bond market. A rise to a new yield high would negate this notion, so continue to follow the 10 year Treasury yield with me.
Rising rates hurt the gold ETF, GLD, this past week once again as you can see at the link to the right.
Here is the interest rate chart for the 10 Year Treasury Note:
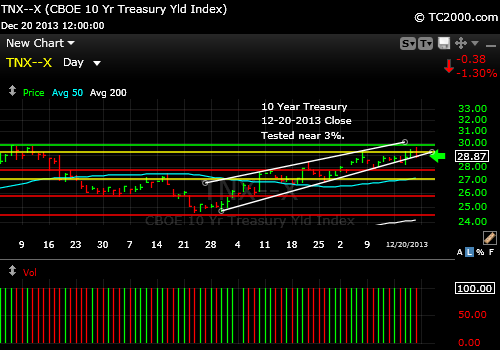
Test of 3% area and followed by a pullback.
Please keep up with my latest thoughts about the markets on the access page on the main website. Get the password here: Free Subscription to My Newsletter
Standard Disclaimer: It’s your money and your decision as to how to invest it.
Follow me on Twitter here: Follow Me on Twitter
I thank Worden Brothers for the chart system I use to post these charts. If you want to know more about the charting system I use every day, go to my “Other Resources” page here: Other Resources It makes it much easier to follow along with me if you can see the charts and manipulate them on your own computer, so it’s a great investment to have an excellent charting system.
Look for updates on the main chart tracking pages this week as I feel they are needed and comments via Twitter.
Copyright © 2013 By Wall Street Sun and Storm Report, LLC All rights reserved.
