A Market Timing Report based on the 12-20-2013 Close published Sunday December 22nd, 2013
The SP500 Index bounced well beyond initial resistance to close the first day above the prior intraday all time high. We need a couple of daily closes up here to verify the move, but the pre-holiday period is often strong on a seasonal basis. Tis’ the season!
We were fully invested going into this move, not shaken out by the last pullback, which has worked so far. Now we see if it sticks. Note the new targets on the chart below, 1842 or even 1889. I’ll be following sentiment as usual for clues as to when the next pullback might be.
Note the big spike in volume on Friday? It is due to option expiration and does not have the meaning of high volume on other days. Of course the fact that the market broke out to a new high on such a day is still positive.
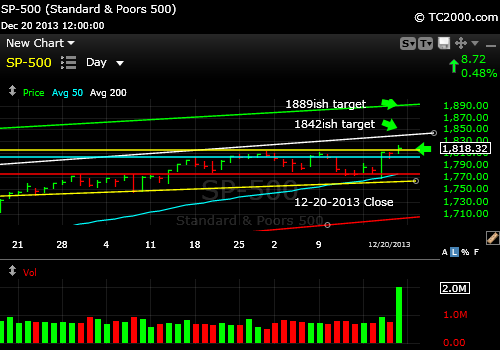
SP500 Index at a New All Time High
I covered my thoughts on investor sentiment for free subscribers on Thursday, so be sure to read them. You can access them after getting the password here: Free Subscription to My Newsletter and access to my latest comments I’ll send you back the password to the access page and the monthly newsletter in the same email.
Standard Disclaimer: It’s your money and your decision as to how to invest it.
I also comment regularly on Twitter: Follow Me on Twitter
I thank Worden Brothers for the chart system I use to post these charts. If you want to know more about the charting system I use every day, go to my “Other Resources” page here: Other Resources It makes it much easier to follow along with me if you can see the charts and manipulate them on your own computer, so it’s a great investment to have an excellent charting system.
Look for updates on the main chart tracking pages this week as I feel they are needed and comments via Twitter.
Copyright © 2013 By Wall Street Sun and Storm Report, LLC All rights reserved.
