
A Market Timing Report based on the 1-10-2014 Close published Sunday January 12th, 2014
Gold responded well to the fall in the 10 Year Treasury yield as employment disappointed this past Friday. Note though that it has merely risen to the 50 day moving average which acted as resistance. The progress is good and verifies our trading buy last week, although the momentum needs to continue into the coming week. Remember this is only a trade and it requires a reasonable nearby stop to protect capital.
When any asset is in a Bear market, I trade it, I don’t invest unless I think the asset is cheap after selling off. Is gold truly cheap? No one can really tell you other than the fact that the prevailing belief is that mines will shut down on gold under 1200 or so. That is what this floor is about they say. We’ll believe what they say if the chart respects what they say and sell when it doesn’t. That’s my plan. Have a plan that suits you. If you merely hold gold as insurance against fiat currencies, fine; keep buying it no matter what the price is.
Here’s the chart:
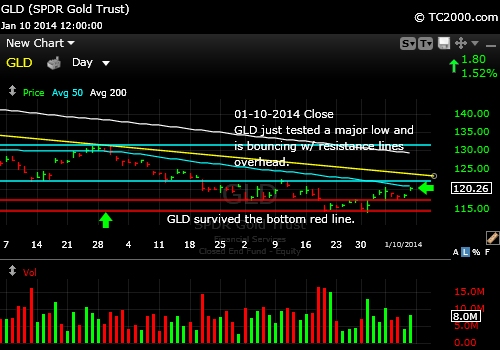
Gold rising from critical support.
To keep up with my latest thoughts on gold on my access page, you’ll need the password, which you can get here:
Free Subscription to My Newsletter Out Sunday Night
Standard Disclaimer: It’s your money and your decision as to how to invest it.
I thank Worden Brothers for the chart system I use to post these charts. If you want to know more about the charting system I use every day, go to my “Other Resources” page here: Other Resources It makes it much easier to follow along with me if you can see the charts and manipulate them on your own computer, so it’s a great investment to have an excellent charting system.
Look for updates on the main chart tracking pages this week as I feel they are needed and comments via Twitter.
Copyright © 2014 By Wall Street Sun and Storm Report, LLC All rights reserved.
