A Market Timing Report based on the 1-17-2014 Close published Monday January 20th, 2014
The 10 Year Treasury yield attempted a rebound from support around the 50 day moving average and has since fallen back for another test. The close on Friday was below the 50 day moving average so the next support is 2.819% at the 1-13-2014 low. A breach there should be celebrated by the metals, housing, and REITs.
The market has been believing that the economy is recovering in which case rates should be RISING, not falling, unless they stay somewhat range bound at levels toward the upper end of the 2013 range. Remember that the Fed has powder it is still expending in buying Treasuries and mortgage backed securities to keep rates artificially low.
The interest rate chart for the 10 Year Treasury Note:
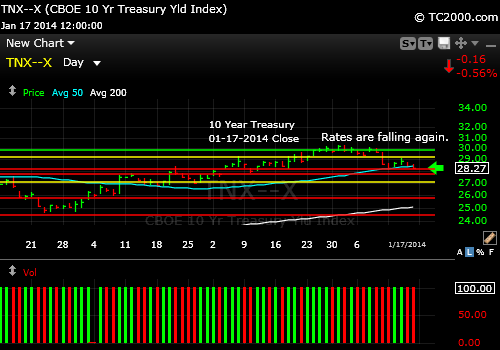
Retest of support.
Please keep up with my latest thoughts about the markets on the access page on the main website. Get the password here: Free Subscription to My Newsletter
Standard Disclaimer: It’s your money and your decision as to how to invest it.
Follow me on Twitter here: Follow Me on Twitter
I thank Worden Brothers for the chart system I use to post these charts. If you want to know more about the charting system I use every day, go to my “Other Resources” page here: Other Resources It makes it much easier to follow along with me if you can see the charts and manipulate them on your own computer, so it’s a great investment to have an excellent charting system.
Look for updates on Twitter: @SunAndStormInv
Copyright © 2014 By Wall Street Sun and Storm Report, LLC All rights reserved.
