A Market Timing Report based on the 3-07-2014 Close published Sunday March 9, 2014
The SP500 Index (SPX, SPY) is now four days over the prior (green ) resistance line as shown on the chart below. The white line above the current price is the next resistance line, now at 1898ish and rising. That channel line could contain the rally. Problems with the Ukraine could also contain the rally. But for now, the Bulls are in charge.
Here’s the SP500 Index Chart (click to enlarge):
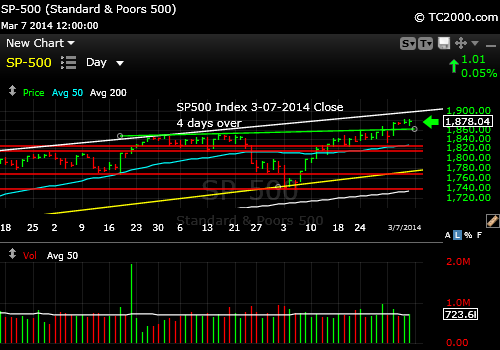
Four days over prior resistance, but must continue moving up soon.
Once again, please read my investor sentiment work from the end of the week if you haven’t. It gives you my latest trading strategy. You can access the work after getting the password here: Free Subscription to My Newsletter and access to my latest comments I’ll send you back the password to the access page and the monthly newsletter in the same email.
NOTE: The Gold and 10 Year Treasury Market Charts have already been posted. See the link to the upper right. Thanks.
Standard Disclaimer: It’s your money and your decision as to how to invest it.
I also comment regularly on Twitter: Follow Me on Twitter
I thank Worden Brothers for the chart system I use to post these charts. If you want to know more about the charting system I use every day, go to my “Other Resources” page here: Other Resources It makes it much easier to follow along with me if you can see the charts and manipulate them on your own computer, so it’s a great investment to have an excellent charting system.
Look for updates this week as I feel they are needed via Twitter.
Copyright © 2014 By Wall Street Sun and Storm Report, LLC All rights reserved.
