A Market Timing Report based on the 4-17-2014 Close published Sunday April 20, 2014
The gold/rate dance continues. Rates crept up, really due to a major jerk up at the end of last week, and gold fell back a bit toward the higher low. What we don’t know is whether the decline will take us all the way back to that higher low as shown on the chart. If it does, it had better bounce, or there will be another level of damage.
For more including other current market/ETF calls : Subscribe to My Newsletter and WSSSR Access Page
GLD chart:
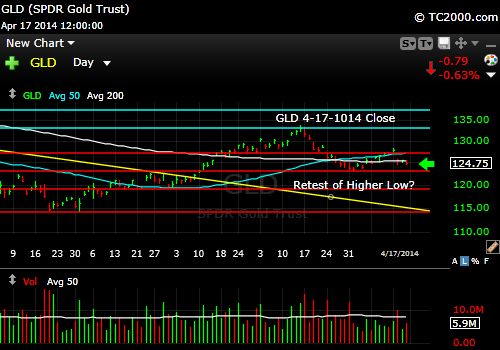
Gold falling back to prior higher low.
Ten Year Treasury Note Yield Chart (TNX, TLT, TBT):
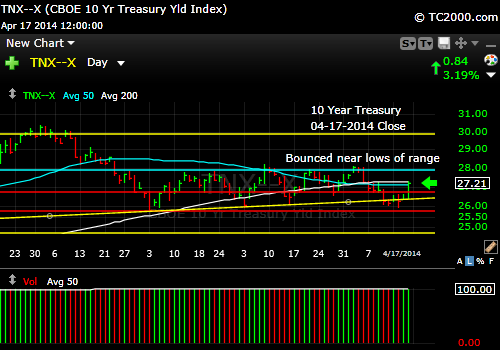
Rates bounced near the bottom of the prior range.
Standard Disclaimer: It’s your money and your decision as to how to invest it.
I thank Worden Brothers for the chart system I use to post these charts. If you want to know more about the charting system I use every day, go to my “Other Resources” page here: Other Resources It makes it much easier to follow along with me if you can see the charts and manipulate them on your own computer, so it’s a great investment to have an excellent charting system.
Look for updates on the main chart tracking pages this week as I feel they are needed and comments via Twitter @SunAndStormInv (see link to upper right).
Copyright © 2014 By Wall Street Sun and Storm Report, LLC All rights reserved.
