A Market Timing Report based on the 6-06-2014 Close, published Sunday June 8, 2014
As Ben Bernanke collects his millions and millions in speech fees having decimated the poor who bothered saving through his near zero interest rates, the SP500 Index (SPX, SPY) is at a new breakout high. And we’ve added to our prior position. That’s not a political statement, but a statement of fact. If you want to know what percent exposure we are at in U.S. large, mid and small caps and in other markets around the globe, including a very recent European addition, subscribe here: Free Subscription to My Newsletter and access to My Latest Comments/Strategy
Resistance is only 1.26% higher at around 1974 for the SP500 index. 1974. Interesting that the SP500 Index low was 666 in 2009 and we’re up 196% from there. Those numbers are numbers you and I should sit with and meditate upon, as they are living proof that markets come back and in general have the tendency to go up over time more than they go down, especially when given ample help by the Federal Reserve. We attempt to find better entry points and exit points, but to be successful, we must stay invested until we get the clearer signals. Or if not, we need to have other ways to counter the effects of inflation on our portfolios.
Here’s the SP500 Index Chart (click to enlarge):

SP500 Index is Headed to the Top Yellow Channel Line
Speaking of inflation, there is not enough of that in Europe, according to Mario Drahgi of the European Central Bank, so he moved one of the bank’s interest rates to a negative number. That has no practical consequence, because there is very little money exposed to those negative rates, but it did indicate that he’s attempting to be creative about increasing European inflation above current levels. The ECB also intends to buy bonds composed of small business loans to stimulate lending (ABC News on ECB: Not the Usual QE).
The other central banks have bought government bonds to lower interest rates directly, but the ECB is balking on that. The Euro actually rallied somewhat, after the news came out.
Following the ECB news, gold (GLD) (click to enlarge) rallied a bit, but the rally is not entirely convincing and could stall as low as the 50 day moving average. Notice how the 50 day just crossed below the 200 day moving average. This is a negative technical signal, so our recent gold buy (see link above to see what we did), is very much a trade. We maintain a long term GLD position as a form of monetary insurance, and even there, we set limits on how much we’ll give back to the house. Betting on disaster is a bet that favors the house, so we protect profits at certain levels.

GLD (gold ETF) rallies a bit after the ECB took action.
The 10 Year Treasury Interest rate (TNX, tracked by TLT if Bullish; TBT if Bearish) continues to move up over further resistance levels as this week’s chart shows (click to enlarge):
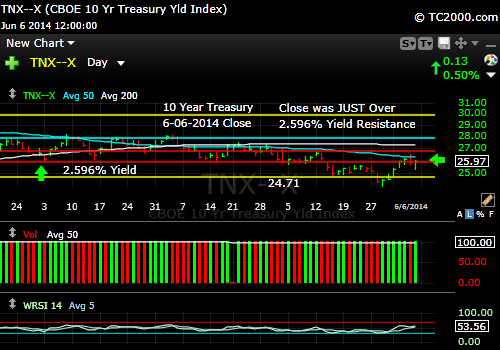
Rates are Rising Again
Rates on the 10 Year Treasury (used to establish important interest rates) did fall back from the 50 day moving average, so the picture is mixed still. Holding the recent lows was positive for higher rates, but failure at the 50 day moving average was not. We expect financials to do well as long as rates keep moving up from here (XLF).
Standard Disclaimer: It’s your money and your decision as to how to invest it.
I also comment regularly on Twitter: Follow Me on Twitter
I thank Worden Brothers for the chart system I use to post these charts. If you want to know more about the charting system I use every day, go to my “Other Resources” page here: Other Resources It makes it much easier to follow along with me if you can see the charts and manipulate them on your own computer, so it’s a great investment to have an excellent charting system.
Look for updates this week as needed via Twitter.
Copyright © 2014 By Wall Street Sun and Storm Report, LLC All rights reserved.
