A Market Timing Report based on the 6-20-2014 Close, published Saturday June 21, 2014
The SP500 Index has established a brand new breakout above the prior breakout high. The Bulls have the ball. The upside to next resistance is at about 1985 (not the year of course, the number). Markets tend to move in waves making higher lows and higher highs in a Bull market. Sometimes they just keep gradually going up, but that is fairly uncommon. What this means is that we must tolerate some volatility to make money in stocks. We are now fully invested, but have more foreign market exposure than U.S. exposure at the moment due to the lower valuations abroad. To see our allocations by percentage, simply subscribe for free here: Free Subscription to My Newsletter and access to My Latest Comments/Strategy.
Here’s the SP500 Index Chart (click to enlarge):
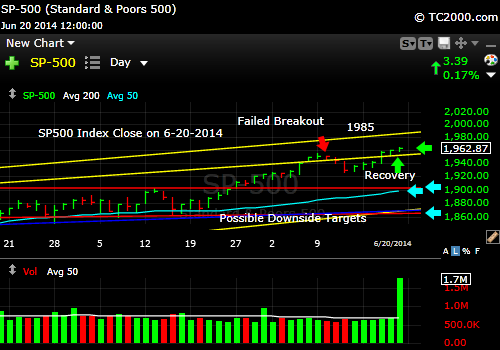
SP500 Index: The Bulls have more upside
Gold (GLD) rallied strongly after the Fed FOMC announcement this past week (they lowered QE by 10 billion in total), so our recent entry is working (click to enlarge the chart):
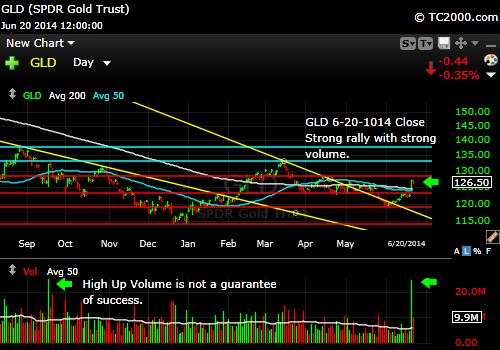
Gold is making more progress since the Fed reassured the markets.
The 10 Year Treasury Interest rate (TNX, tracked by TLT if Bullish; TBT if Bearish) (click to enlarge):

Rates go sideways after the Fed statement.
There were no rate fireworks post-Fed announcement. The market seems satisfied that the Fed will control the range of rates within reason. But the real issue is what will happen when the Fed is no longer buying more Treasuries back than are being issued by the Treasury Department. That inflection point may drive rates up at least moderately, and as QE will end in October, the inflection point could occur before then.
That said, some seasoned investors who have been correct about interest rates for many years now, contend that the decline in rates is not yet over. One prominent voice in that direction is Gary Shilling. Since he’s been right, we need to take note that he may continue to be correct. If he’s right, both the bond and the stock market will continue to do fine. Overvaluation will be dealt with along the way, but those companies who are rewarding investors with strong earnings, buybacks, dividends, and debt reduction will do well.
The other big wild card out there is Iraq. The terrorists are advancing as our leadership says the Iraqis must step up and face ISIS or we can’t help them. ISIS knows that Americans are weary of war. Yet the trillions we spent and the sacrifices of the young men and women we’ve lost and who have been injured could be unraveled if we fail to act. Unfortunately, more war spending would hardly help our Treasury balance, putting direct further financial strain on our system. The markets could react negatively as things develop. It would be great if the Iraqis could unite against this massive threat. Risk rises if they don’t.
Don’t miss out on my comments on Twitter this week. You can read my Tweets whether you have a Twitter account or not: Follow Me on Twitter
Standard Disclaimer: It’s your money and your decision as to how to invest it.
I thank Worden Brothers for the chart system I use to post these charts. If you want to know more about the charting system I use every day, go to my “Other Resources” page here: Other Resources It makes it much easier to follow along with me if you can see the charts and manipulate them on your own computer, so it’s a great investment to have an excellent charting system.
Copyright © 2014 By Wall Street Sun and Storm Report, LLC All rights reserved.
