A Market Timing Report based on the 8-25-2017 Close, published Sunday, August 27th, 2017
I deliver focused comments on market timing once or twice a week. These are supplemented with daily “Tweets/StockTwits” (see links below).
1. SP500 Index: This is what many summers and falls “feel like.” They can be rough on traders and investors alike. Market timing approaches require shorter time frames during this period.
Technically speaking, the SP500 Index is sagging below a head and shoulders top formed with the left shoulder in June and the head in August. The last such formation was in Summer of 2016, which ended with a slump off the right shoulder. If things proceed as they did before, we can look forward to either a retest of the Aug. 21st low of 2417.35 or the 6-29-2017 low of 2405.70. Technically, the last four days could be seen as a sloppy consolidation (sideways move), but I would say the Bears have a slight edge. The good news? As long as the economy remains on track, this pullback should be temporary.
Meanwhile, despite the leadership disarray in both Congress and in the White House, investors are looking for tax reform by the end of the year. We were told by Treasury Secretary Mnuchin this week a government shutdown was NOT going to be an issue. A budget still needs to be passed and Trump has threatened a government shutdown if he does not receive funds for his pet wall project (hint: The Rio Grande River which marks many miles of our southern border cannot be bounded by a wall as it would force flood waters into Mexico. For that reason, building one would be illegal by international law.) Technology is clearly a better solution along much of the rough terrain at our southern border.
For Trump, the “wall” is of symbolic importance more than anything, so Congress may give him enough of a wall to show something to the public and prove his accomplishment to his supporters. I would hope the stock market can read between the lines on all but tax reform. The market will not look past a tax reform failure. Tax reform is the one thing the market expects, including some sort of repatriation of earnings stashed abroad by the US multinationals.
Keep up-to-date during the week at Twitter and StockTwits (links below), where a combined 29,801 people are joining in…
Twitter® Follow Me on Twitter®. Follow Me on StockTwits®.
SP500 Large Cap Index (click chart to enlarge; SPX, SPY):

More weakness ahead?
Survey Says! Sentiment of individual investors (AAII.com) showed a Bull minus Bear percentage spread of -10.19% vs. +1.37% last week.
Investor Bearishness has perked up a bit, but is nowhere near the big numbers seen at big turns (Bull Bear spreads of 20-30% or more). The degree of Bearishness we had this week can be an inflection point UP at times, but this surge in Bears has not occurred at what looks like a market bottom. My sense is there will be a bit more market weakness this round. Check out my current investment level at the social media links above.
| Thurs. 12 am close to poll | Bulls 28.10% | Neutrals 33.61% | Bears 38.29% |
2. U.S. Small Caps: Small caps had a weak market timing bounce up this week, but technically, nothing much was accomplished unless there is an assertive continuation of this move. Only a charge up and through the orange “Trigger Line” would convince me the last low means anything. Look at the chart. It’s a lower low vs. the immediately prior daily low on 8-11. It becomes a higher low vs. the March low only if the rally continues with strength.
Russell 2000 U.S. Small Cap Index (click chart to enlarge; IWM, RUT):
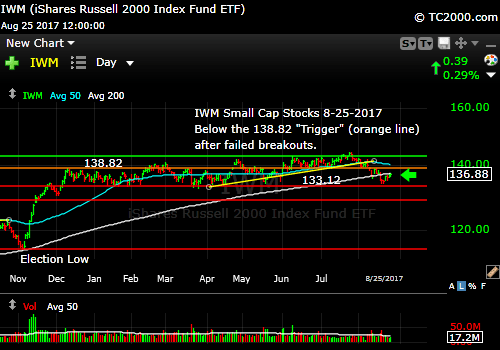
Bouncing, but how far?
3. Gold: We need a new 2017 high in gold – right away, or we’ll have a marketing timing top. That would be a close over 123.31 and usually traders look for several higher closes over a resistance level to confirm a move. Trade accordingly. Rates were testing last Friday’s low this Friday and that bodes well for gold, but another rate breakout to the downside (below 2.163%) will be needed to seal the deal. It may not come, so be nimble.
Gold ETF (click chart to enlarge the chart; GLD):
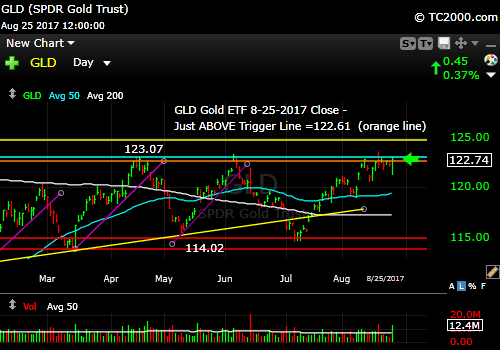
Gold still looking for a new breakout.
4. U.S. 10 Year Treasury Note Yield (TNX): The 10 Year Yield is below the market timing trigger line (in orange in the chart below) for Trump growth. As I’ve recited many times, rates normally rise as an economy heals, so they should be rising now. If we do not see rates rise soon, you won’t see the stock market rallying to new highs in my view. They don’t have to move that high, perhaps to an upper range of 2.489% to 3%. Then they could slosh around in a fairly low range through the end of this economic recovery. The good news is GDP is set to continue to rise in the coming quarters, provided the President can get back on track and focus on the important business at hand, namely, tax reform.
There are two pivotal things that need to be accomplished in tax reform. 1) A Middle Class tax cut. If President Trump breaks his promise of giving the most back to the middle class over the upper class, 2018 and 2020 could be rough on the Republican Party. 2) A Lower Corporate Tax Rate along with repatriation of money held overseas by our big companies at a low tax rate. U.S. corporate taxation must become more competitive, or we’ll continue to lose business to other countries.
Now we need to review our three signals (below the chart after you review it…)
U.S. 10 Year Treasury Note Yield (click chart to enlarge; TNX, IEF, TYX,TLT,TBF):
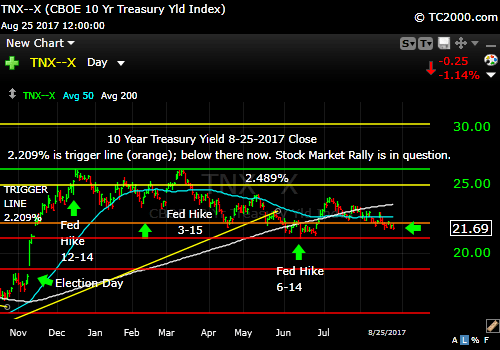
10 Year Yield below the orange “Trigger Line.”
Let’s review the three market timing signals together….
MY SIGNAL SUMMARY for a Further U.S. Stock Market Rally:
Stock Signal OFF (Small Caps below “Trigger Line”; lack of a broad rally is a negative for stocks).
Gold Signal OFF (GLD above the “Trigger line” which is good for gold, not stocks, though barely OFF).
Rate Signal OFF (10 Year Yield below the “Trigger Line,” good for bonds, not stocks).
Thank you for reading. Would you please leave your comments below where it says “Leave a Reply”… or feel free to ask a question… Pay it forward too by sending the link to MarketTiming.Blog to a relative or friend. Thank you.
Note: My monthly newsletter is now CLOSED to new subscriptions until late this year. I’ll let you know here if and when it reopens.
Be sure to visit the website for more general investing knowledge at:
Standard Disclaimer: It’s your money and your decision as to how to invest it.
I thank Worden Brothers for the charting system I use to post these charts. If you want to know more about the charting system I use every day, go to my “Other Resources” page here: Other Resources It makes it much easier to follow along with me if you can see the charts and manipulate them on your own computer. It’s a great investment to have an excellent charting system. Check it out with a free trial at the link above.
Copyright © 2017 By Wall Street Sun and Storm Report, LLC All rights reserved.
