A Market Timing Report based on the 4-20-2018 Close, published Saturday, April 21st, 2018…
I deliver focused comments on market timing once or twice a week. These are supplemented with daily “Tweets/StockTwits” (see links below).
1. SP500 Index Market Timing: The US equity markets were trending up for 6 out of 8 days in the last run up. Volatility was coming down gradually from well above 20 after peaking at 50.30 on 2-6-18. The markets first major low off the all time high was on 2-09-18 three days later. At the last high of the market on 4-18, volatility was rising rather than falling, which was a hint of things to come. The market then fell Thursday and Friday, importantly, below the high of the previous prolonged consolidation (sideways move). The top of that move was S*P*Y 266.77 and the close was at 266.61. (I add the * signs here and on my social media feed to avoid bots finding the numbers. May as well not make it easy for them!)
Earnings were not enough to keep the market above this key level, which is a negative. On the positive side, professional investors at least are maximally Bearish at this point, which is one sign things are getting too negative. I’ll get to individual investor sentiment later, which is NOT as Bearish. Advisor sentiment LED individual sentiment on the way up, and I suspect it’s now leading on the way down.
The close below that level is negative, but not necessarily lethal, though my measures of buying strength did not show enough buying interest off the low on Friday to make the market a buy. The S&P500 Index needs to recapture that level early on Monday to avoid further damage.
As I said on StockTwits/Twitter (links below) on Friday, the most Bearish intepretation is that the chart is the perfect picture of a market rolling over once again after a failed rally to just above the 50 day moving monkey average. “Monkey,” because using it as a trading signal is not very useful. It’s just a marker along the way and one has to assess market strength in any one moment to know whether a marker means something or not. Notice how the market tested above this moving average twice before this for the two prior lower highs. Some investors are pulled in as the market moves above the line and then the big boys and girls come in and “Sell, sell, sell!” as my friend Jim Cramer likes to say (not a drinking buddy no; just exchange comments from time to time).
The really big economic number coming out this next week (Fri. April 27th, 8:30 am ET) is GDP, the first estimate for Q1 2018. Econoday says HERE that headline U.S. GDP (Seasonally Adjusted Annualized Rate of Growth) will be:
| Real GDP – Q/Q change – SAAR | Prior 2.9 % | Consensus 2.0 % | Consensus Range 1.3 % to 2.8 % |
Two independent sources stated last week that they expect the headline GDP number to fall at the low end of that range, which could be taken negatively by the market. You see, we know profits will remain strong throughout the year for the SP500 on a quarter by quarter basis vs. the same quarter of 2017, but we don’t know if revenues will continue at the prior growth level. In fact, GDP is supposed to slip into the end of 2018 even according to the Fed’s dot plots.
Remember, Trump/GOP Tax Reform has given companies an instant pass on earnings for the entire year. That creates a much higher earnings bar for 2019 This means that immediate earnings are not as important going forward as are revenue growth and company profit projections into 2019.
You had better be sure the companies you own shares of have more to say than “Profits are up for this year, but…as for 2019, it’s not going to be as hot or we see lower revenues in Q3 and Q4 of 2018 than we expected.” Those stocks will tank.
Let me turn now to the potential drag of slowing growth around the world outside the U.S. This will hurt U.S. multinationals. This chart of France’s PMI is just one example showing how things are slowing already in Europe as shown HERE. The same slowing is reported in China a major source of U.S. multinational sales growth.
The point of this? U.S. GDP growth is slated to decline into the back half of 2018. If interest rates rise much further AND oil prices continue to climb, profits will be hit from both the revenue side and the cost side, especially for companies with the most debt.
Trump and the GOP are successfully generating inflation, because they chose to engage in a late economic cycle stimulus. When you push an economy already running at 4%ish unemployment, you create inflation. As a fiscal conservative, I never liked the idea. If they wanted to cut taxes, they should have cut spending along side the tax cuts! I am very happy to be an independent as BOTH parties are now being led by big spenders! Trump warned the electorate that he “loves debt.” And here it is…piling up in a massive National Debt that he intends to dump on our kids and grandkids!
The upshot of TrumpFlation is higher gas and other prices that will compete away dollars received in the form of higher wages in a tight labor market. This will in turn drive down corporate profits, leading to a profit recession and as GDP slumps, possible stagflation or a return to deflation if the economy rolls over and the Fed is forced to lower rates to zero again. The economy can stand mild inflation, but not high inflation, and global slowing is likely to dampen U.S. multinational profits and even create a profit recession. Outright economic recession could follow that, but we’ll have to let time pass to see the trajectory of U.S. GDP.
All that said, what do I expect in the near term? (one or two quarters)
I expect somewhat higher inflation with corporate profit growth slowing (except for energy and commodity companies). Profits will initially stay positive and that alone will help markets from falling to a brand new low. This means that stocks could hold up OK and stay in a trading range between the 200 day moving average or the February low at the low end and the all time high at the high end.
On the Bullish side, I cannot rule out a complete re-topping of the market, short of any big negative events such as a Trump impeachment (unlikely in my view at this point despite the speculation; plenty of people could fall around him without Trump himself being impacted). Investors will be looking for higher yields in both stocks and debt. As inflation rises, bonds will take somewhat of a hit, and dividend bearing stocks will be pressured despite the attempts to chase returns.
Then as GDP growth and inflation slows into year end 2018, yields will ease and provide a better trading opportunity in bonds and Treasuries of longer term duration. Stocks will could then slump further on decreased growth.
Summary: A range bound U.S. stock market for one to two quarters, then a fall to new lows as the U.S. economy slows on a lag to the rest of the world. The risk is that the U.S. stock market starts to discount foreign slowing early. This would hit multinationals hardest and then small and mid caps if/as such slowing continues. On the plus side would be a GDP growth surprise from the tax cuts. This is why we consider the fundamentals, but then follow the charts! 😉
The top of the range we were following was between 2672.08 and 2674.78. Let’s follow the higher of the two as the “switch point.”
SP500 Large Cap Index (click chart to enlarge; SPX, SPY):

Rolling over to the prior low?
See what my exposure is at the social media links just below…
Keep up-to-date during the week at Twitter and StockTwits (links below), where a combined 33,400+ people are joining in…
Follow Me on Twitter®. Follow Me on StockTwits®.
Survey Says! Sentiment of individual investors (AAII.com) showed a Bull minus Bear percentage spread of +8.56% vs. -16.66% TWO weeks ago. Sentiment did not become Bearish enough over the prior two weeks to say we hit a reasonable sentiment low. Unlike advisor sentiment which is extremely Bearish by reports, individual sentiment was mildly BULLISH at last check. This favors more immediate downside at least to the prior levels of support. This is, however, only ONE factor I follow and these non-extremes have to be discounted vs. the true massive extremes such as the one I spotted in January before the big decline.
| AAII.Com Individual Investor Sentiment Poll | ||
| Bulls | Neutrals | Bears |
| 37.78% | 33.00% | 29.22% |
| Thurs. 12 am CT close to poll | ||
2. U.S. Small Caps Market Timing: Beginning March 2nd, small caps have been outperforming. BUT they are now forming another lower high, which is not great. The out-performance may be due to a feeling that international slowing is leading U.S. slowing, which will pinch U.S. multinational profits first. However, small caps will not do well if inflation rises further than expected, as they tend to carry more debt. That gives small caps a mixed risk picture vs. large. If you intend to stick with a small cap position, continue to follow their leadership over large and rotate when that fails.
Russell 2000 U.S. Small Cap Index (click chart to enlarge; IWM, RUT):

Small caps still leading large…so far since the 1-26 top.
3. Gold Market Timing: Still following the U.S. Dollar like a little puppy.
The same trading advice applies as well: Preserve gold profits if you have them and ADD to your positions only if gold can break the obvious lid to the upside.
The Gold ETF (click chart to enlarge the chart; GLD):

Dollar up, gold down.
4. Interest Rate Market Timing – U.S. 10 Year Treasury Note Yield (TNX): Rates are already much too high for the current economic conditions. They went higher this week, so this adds further “cost input pressure” to stocks. Higher rates and oil prices both lead to higher input costs.
U.S. 10 Year Treasury Note Yield (click chart to enlarge; TNX, IEF, TYX,TLT,TBF):
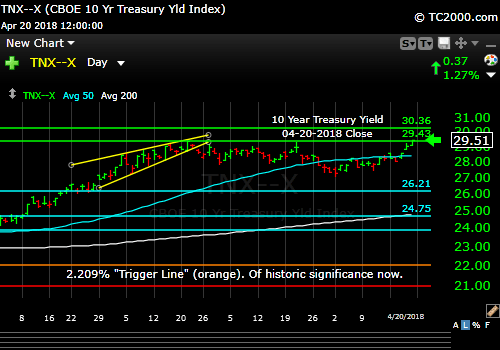
Challenge of 2014 high ahead?
In the last issue I reviewed “How to Beat This Market” HERE.
Now let’s review three key market timing signals together….
Do not use these signals as a trading plan. They are rough guidelines. I currently share my own moves on social media (links above).
MY SIGNAL SUMMARY for a Further U.S. Stock Market Rally with GDP Growth and Low Inflation:
Stock Signal YELLOW with a Bearish SP500 Index trend. The S*P*Y must reclaim 266.77 (S*P*X 2674.78), which it could do Monday, to turn back to neutral. I would see that reversal as somewhat Bullish actually if it sticks. A quick test above means nothing. Testing the prior low sooner rather then later could still be constructive, but buying there would require a reasonably tight stop!
Gold Signal YELLOW with a Neutral Gold Trend. Same as before: “You may as well wait to buy a breakout in gold as the distance to the top is not that great. Preserve gold profits if you have them.”
Same Idea as Last Time: The failure to make a new high makes the trend “Neutral” for me rather than Bullish. To Repeat: Remember GLD is being used as an indicator for the ECONOMY here. A new recent LOW in GLD will turn the signal GREEN.
Rate Signal GREEN with a Bullish short term 10 Year Yield Trend. Yes it changed since my last issue. Resistance is just overhead at 3.036% though. The market may signal being overbought when we get there. We shall see.
To Repeat: “Remember this too is a signal for a “further stock market rally” as it’s being used here. Remember “Bullish” for yields is Bearish for bonds and vice versa.
Note: I’ve updated my criteria for the equity signal for a further U.S. stock market rally to the following: GREEN = Bullish, YELLOW = Neutral, RED = Bearish.
Explanation: Note that a RED signal does not mean we should not buy. A GREEN signal does you cannot sell some exposure. It depends on what is going on in the economy and how oversold/overbought the market is at a given point whether the Bearish signal is to be sold, sold on the next bounce, etc. and whether a Bullish signal is to be bought or profits should be taken. YELLOW does not mean the end of the Bull or Bear. It means look for possible entry points within the existing trend, Bull or Bear, but preserve capital if the entry fails. Our strong intention is to buy low and sell high. By the way, I will keep showing the prior orange “Trigger lines” in the charts for now as reference points only; they have historical value for us from the post-election period.
Thank you for reading. Would you please leave your comments below where it says “Leave a Reply”… or ask a question… Pay it forward too by sending the link to MarketTiming.Blog (that link will immediately connect them to this webpage) to a relative or friend. Thanks for doing that.
Be sure to visit the website for more general investing knowledge at:
Standard Disclaimer: It’s your money and your decision as to how to invest it.
I thank Worden Brothers for the charting system I use to post these charts. If you want to know more about the charting system I use every day, go to my “Other Resources” page here: Other Resources It makes it much easier to follow along with me if you can see the charts and manipulate them on your own computer. It’s a great investment to have an excellent charting system. Check it out with a free trial at the link above.
Finally: Excuse and report all typos if you are so moved. I do my best to pick up most of them, but can’t find them all. Shoot me a comment (I don’t have to post the comment as I filter them, but I’ll be grateful to you!)
Copyright © 2018 By Wall Street Sun and Storm Report, LLC All rights reserved.
