A Market Timing Report based on the 5-04-2018 Close, published Sunday, May 5th, 2018…
I deliver focused comments on market timing once or twice a week. These are supplemented with daily “Tweets/StockTwits” (see links below).
1. SP500 Index Market Timing (S&P 500 Index®; SPY, SPX): Did the Intel-igent signal from Intel flash this week either Bullish or Bearish? I would say no as it was 52.73 on the close the prior Friday and this Friday it was 52.78. Hardly progress.
A major question being asked by Bears is “Is this as good as it gets?” And these people don’t eat with plastic forks and harass their waitresses either. Well, maybe they do the latter. But are profits as good as they will get this cycle, or is there more to come? If there is less to come, that means growth is slowing, and if growth is slowing the valuations of growth stocks in particular must come down. If a stock is selling at a PE ratio of 25, well above the market, and does not have growth to match it of roughly 25%, it no longer deserves that PE ratio (that is a very rough approximation of course).
Facebook, for example, according to Yahoo Finance has a PEG ratio of 0.87 vs. 5 year expected growth, while it sports a PE ratio of 20.23 on a forward basis and a PE of 32.77 on a trailing twelve month basis (TTM). Skyworks (SWKS), which recently fell on speculation Apple would fall short in its earnings report, has a PEG ratio of 0.88 with a forward PE of 11.86 and a TTM PE of 21.79. If Facebook earnings were to start growing at a lower rate due to increased costs of kicking terrorists off its network, while Skyworks’ prospects remained constant, it would be logical for Facebook’s price to fall vs. Skyworks’.
If earnings have peaked out, because there are no more tax benefits to accrue and adding to that, Europe and China are slowing vs their prior growth rates, so our multinationals cannot sell as much into those markets, then PE’s should adjust downward, and the hit will be most brutal for the high growth companies with expectations that have been inflated by the recent extraordinary conditions of loose monetary policies around the world.
Speaking of China, the Trump negotiators headed by Sec. Mnuchin failed to secure any meaningful concessions from China on first report. This could continue to pose downside risk to the markets, should Trump decide “we need to take a hit” for the long run and wage a trade war. The current state of things, namely the huge deficit we have with them goes back many years and should have been dealt with structurally long ago, but politicians just don’t have the insight or guts to do it. So here we are….
My view of things is that they could stretch out the trade yapping long enough that the market will cease caring about it. If they bring it to a head by instituting the big tariffs right away, things could get messy. Americans will pay in the form of higher prices if we do have a trade war, which means less income to buy things, which means a slower U.S. economy.
Let’s assume the best outcome. Even if there is no all out trade war, instead, a gradualist approach, Trump is not impeached (no clear evidence to date whatever you or I think of him), and the U.S. economy slows but does not move into negative GDP status (recession), the markets could easily see more PE compression particularly in high growth companies, which means prices fall. Stocks that are better valued vs. their growth will come down less hard and bounce sooner.
But that does not mean you can avoid all losses by being in value stocks. Markets become highly correlated during big declines. In addition, valuation is relative and as tech companies actually become reasonable in valuation after falling, and investors do buy them eventually. Off the 2000-2003 Tech Crash lows, you made more by buying growth stocks than value stocks.
In 2006-2007 as the SP500 was peaking, value stocks were doing better, but then did worse during some periods after the market started to fall apart due to the housing crisis. The overvaluation of tech stocks in that period was not as extreme as it was for the dot.com stocks. Moral of the story? You won’t be able to hide in value stocks if the market goes into a true “Big Bear Market” or even a “Mini Bear Market” as I’ve called them (see definitions HERE in BLUE).
What actions should be considered? I’ll summarize that at the end of this brief, but first, have a look at the SP500 Index Chart and then we’ll move on to investor sentiment…
SP500 Large Cap Index (click chart to enlarge; SPX, SPY):
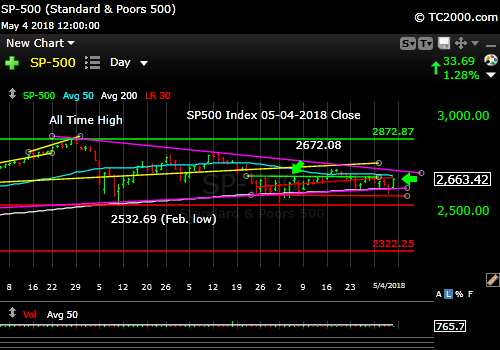
Stuck in a triangle.
See what my exposure is at the social media links just below… I raised it a bit more this past week.
Keep up-to-date during the week at Twitter and StockTwits (links below), where a combined 33,466 people are joining in…
Follow Me on Twitter®. Follow Me on StockTwits®.
Survey Says! Sentiment of individual investors (AAII.com) showed a Bull minus Bear percentage spread of -1.85% vs. +11.36% a week ago. As my long term readers know by now, generally, only the extremes of sentiment are helpful in predicting turns in the market such as the January signal that flashed a big warning.
One number, not the spread, is actually Bullish. The high neutral number has an above 80% correlation with the stock market being up 6 months from now per AAII. Remember, this is just one signal I follow and other things need to fall into place before I will add to my current exposure (revealed at links above). But this week’s data do say “Be cautious about selling now.”
If you sell, sell the stretched points in the charts, not the lows. And consider adding back exposure when the charts are stretched to the downside, as I did several times over the past couple of months. My last timestamped buys were on 4-24 and 4-25, right at the prior low with additional adds this week. Because I had already added back enough exposure, there was no reason to add broad market exposure on 5-03, in case you were wondering.
| AAII.Com Individual Investor Sentiment Poll | ||
| Bulls | Neutrals | Bears |
| 28.40% | 41.36% | 30.25% |
| Thurs. 12 am CT close to poll | ||
2. U.S. Small Caps Market Timing (IWM): Small caps have been leading off the 1-26 all time SP500 Index high. They have both fallen less and risen more quickly off the lows. Recently off the April 2nd low, IWM is up 5.13% vs. SPY, up 3.32% including dividends (per a site that is “not secure,” although Norton rates it as safe: HERE). IF the U.S. dollar continues up, which will occur IF rates keep going up in the U.S., THEN small caps will continue this out-performance. Meanwhile, small caps are also stuck in a triangle, but leaning UP.
Russell 2000 U.S. Small Cap Index (click chart to enlarge; IWM, RUT):

Small caps still triangulating too.
3. Gold Market Timing (GLD): As I explain in a prior article on this site (Google “When does gold shine and when does it decline?”), gold only goes up WITH the U.S. dollar when there is financial panic. Since the dollar started going up on 4-19, gold has gone down. Rates have slowed their rise, so the dollar has too. Gold MUST hold its obvious base of support. Otherwise…it heads down another notch. Selling now is “selling late” most likely. If rates keep climbing, GLD will likely fall well below the orange line shown.
The Gold ETF (click chart to enlarge the chart; GLD):
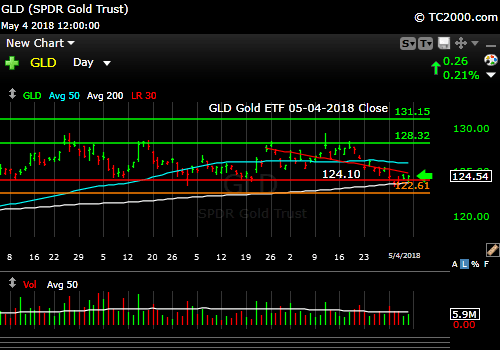
Gold and the dollar are linked arm and arm.
4. Interest Rate Market Timing – U.S. 10 Year Treasury Note Yield (TNX): I said last week: “If inflation is still heading up as mentioned, rates should NOT break down below the 2nd green line from the top.” In dog terms, the market “peed on my number.” For those adverse to canine urinary analogies, “it verified 2.943% as an important target this past Friday.” Falling back below that level is a sign of possible economic slowing in the U.S. as mentioned. Rates should keep climbing IF the expansion is continuing based on current policies…and your hard work!
First review the rate chart below and THEN we’ll talk strategy:
U.S. 10 Year Treasury Note Yield (click chart to enlarge; TNX, IEF, TYX,TLT,TBF):
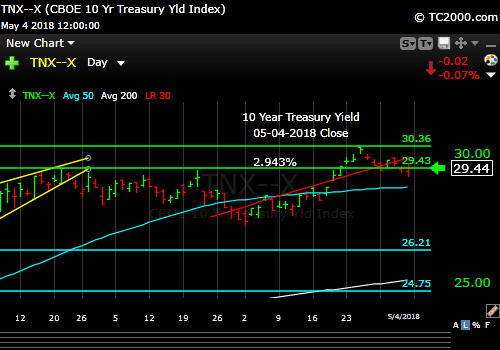
Rates should stay at these levels or move higher until the inflation rate falls.
How about actions to consider? (I wrote about some other ideas on a prior action list on How to Beat This Market HERE) This list is updated for the current circumstances, but the prior list still applies.)
- Lowering your exposure to tech stocks and other highly valued companies if they begin to report softer numbers. Do it quickly when weakness arises, because you’ve seen how fast the market can punish stocks these days. Don’t think you’ll “ride it out.”
- Preserving profits that you have using trailing stops. You must consider volatility in doing so. Give more volatile stocks more room than less volatile stocks. Using trailing stops based on volatility, you can avoid giving up all of your hard earned profits. One suggested trailing stop I saw at the SP500 top was around 9.5% from the top, for example, but for the much more volatile Amazon, at that same time, the trailing stop suggested was about 18.5% below the market price. I don’t use any single system to determine exits, but I use a specific system, which I pay for, as a wake up call especially for individual stocks that are much more volatile than the indexes. I must at least have a clear idea as to why I am staying in the stock or index if my chosen alarm system goes off… If you would like access to a better system to determine volatility adjusted stops like this, please send me a note via the contact box HERE.
- If you lower your exposure in one market, consider moving those assets to markets that are working, but be careful not to move from one slowing market to another. “XYZ Country is cheap, so I can buy it” is a dumb approach unless you can wait 10-15 years to get your money back. Cheap can remain cheap for years. And cheap can become cheaper!
- Simply raising your cash level by taking some profits on the swings up in particular. You can sell lower on breakdowns in charts, OR you can sell the bounces to lower highs. Your choice! Holding more cash will reduce your gains if the market goes straight up from here, but holding none does not allow you to buy back lower should the market fail miserably. If you aren’t sure about this, take a small amount out of the market such as 10% vs. what you normally hold – if you normally hold 60% stocks, you would move to 54% for example. Even that will give you more flexibility on a big decline. Some of you will choose to be more aggressive, especially if you need to preserve college funds or if you are overdoing it as far as your stock exposure is concerned. To each, his or her own…
- Realize that inflation can create the illusion of having your stocks “do OK,” while after inflation you are actually losing real net worth.
- Realize that investing in a time of higher inflation is NOT like investing in a time of lower inflation. Right now inflation is rising. Inflation sensitive businesses are being hit hard right now (consumer staples), because they cannot immediately raise their prices as their input prices go up. Eventually they do, however, because they are forced to in order to survive and their competitors are also raising prices anyway.
- Realize the period of higher inflation may be a brief window, because the world could move back into a deflationary, low growth mode after the near term period of rising inflation. In other words, higher inflation and Federal Reserve tightening can lead to profit recession and disinflation and then to economic contraction and deflation. The upshot of this is that I am going to lengthen the duration of my Treasury holdings/bonds when I see interest rates peaking and stick to individual bonds. If interest rates move straight down from here, then I’ve missed this window already, although I did go out as far as 1 year with new cash.
- Whatever you do, as I said on my prior list, in general, DO NOT CHASE STOCKS. If you chase them, please be willing to SELL them if your thesis fails, in order to limit losses. Buy Low, Sell High! That is the current game we’re in. In these Bearish periods, it’s usually wise to “let that one go,” if you fail to buy something fast enough, such as buying Apple at the high on Friday AFTER the Buffett news. That would have been a BAD trade regardless of the outcome! If Jack makes money by being dumb, good luck to him in making that work in the long term. If you have no system, you won’t be able to reproduce your good results consistently based on random thoughts leading to stock chasing.
Now let’s review three key market timing signals together….
Do not use these signals as a trading plan. They are rough guidelines. I currently share my own moves on social media (links above).
MY SIGNAL SUMMARY for a Further U.S. Stock Market Rally with GDP Growth and Low Inflation:
Stock Signal YELLOW with a Neutral SP500 Index trend. For 2 weeks I’ve said: “The S*P*Y must reclaim 266.77 (S*P*X 2674.78), which it could do Monday to turn back to neutral.” The close was at SPY 266.02, still below that number. The SPX must break the triangle shown to the upside to become Bullish again, but a close above 266.77 is the next step for the Bulls.
Gold Signal YELLOW with a Neutral Gold Trend. Last time I said: “Now the advice is “Buy the low” if we get back there for more aggressive traders, OR preferably buy when you see the dollar falling for the 2nd or 3rd day.” We are near a key low now. If you bought the low, you are already a bit ahead, but watch rates and the U.S. dollar like a hawk!
Remember GLD is being used as an indicator for the ECONOMY here. A new recent LOW in GLD will turn the signal GREEN.
Rate Signal GREEN with a Bullish short term 10 Year Yield Trend but barely this week, as we’re just 0.01 above a key number as discussed above. Rates fell from the 2014 high of 3.036%, but the TNX is still above the prior breakout level of 2.943%. If it breaks that level, it becomes Neutral Trend.
Remember this too is a signal for a “further stock market rally” as it’s being used here. Remember also “Bullish” for yields is Bearish for bonds and vice versa. There is a twist here though. This level of the 10 Year Treasury Yield, which is too high for current conditions as explained HERE, will eventually slow the economy in my view (not to mention Gundlach’s view).
Note: I’ve updated my criteria for the equity signal for a further U.S. stock market rally to the following: GREEN = Bullish, YELLOW = Neutral, RED = Bearish.
Explanation: Note that a RED signal does not mean we should not buy. A GREEN signal does you cannot sell some exposure. It depends on what is going on in the economy and how oversold/overbought the market is at a given point whether the Bearish signal is to be sold, sold on the next bounce, etc. and whether a Bullish signal is to be bought or profits should be taken. YELLOW does not mean the end of the Bull or Bear. It means look for possible entry points within the existing trend, Bull or Bear, but preserve capital if the entry fails. Our strong intention is to buy low and sell high. By the way, I will keep showing the prior orange “Trigger lines” in the charts for now as reference points only; they have historical value for us from the post-election period.
Thank you for reading. Would you please leave your comments below where it says “Leave a Reply”… or ask a question… Pay it forward too by sending the link to MarketTiming.Blog (that link will immediately connect them to this webpage) to a relative or friend. Thanks for doing that.
Be sure to visit the website for more general investing knowledge at:
Standard Disclaimer: It’s your money and your decision as to how to invest it.
I thank Worden Brothers for the charting system I use to post these charts. If you want to know more about the charting system I use every day, go to my “Other Resources” page here: Other Resources It makes it much easier to follow along with me if you can see the charts and manipulate them on your own computer. It’s a great investment to have an excellent charting system. Check it out with a free trial at the link above.
Finally: Excuse and report all typos if you are so moved. I do my best to pick up most of them, but can’t find them all. Shoot me a comment (I don’t have to post the comment as I filter them, but I’ll be grateful to you!)
Copyright © 2018 By Wall Street Sun and Storm Report, LLC All rights reserved.
