A Market Timing Report based on the 11-02-2018 Close, published Saturday, November 3rd, 2018…
I deliver focused comments on market timing once a week. These are supplemented with daily “Tweets/StockTwits” (see links below).
1. SP500 Index Market Timing (S&P 500 Index®; SPY, SPX):
Last week I asked, “Will the May Low Hold?”
It did, and a bounce began from it. Realize that tests sometimes go a bit farther than the original lows that are tested. A breach intraday does not mean the same thing as a closing breach, which is why many traders use only closes to determine whether they will sell. Before getting deeper into the charts, let’s review the major current market challenges and their importance:
1. The 2018 Midterm Elections: The Democrats are currently expected to win the House back and the Republicans are expected to make some gains in the Senate or at least hold on to a majority. This scenarios should be OK with the market, although given committee control, the Dems would initiate further investigations into Trump’s election activities, his tax returns, and Kavanaugh.
They may even impeach him in the House, but I think that is hardly a given as these things come back to haunt when reasonable standards are overstepped. Impeachment would make a Mini Bear more likely as defined last week. The Senate, under GOP control will of course not convict him unless he has done something they cannot overlook. I think the Mueller investigation will dead end before it reaches Trump – if he was in fact smart and kept “out of it,” also not a guarantee, given his ego issues.
The best scenario for the market, but not necessarily for people on Medicare and Social Security, and for those with pre-existing health conditions, would be an all GOP win scenario.
A double Dem win in both Houses of Congress, would be a threat to the market and could lead to much more turmoil and uncertainty for the markets. Such a win is not predicted at this time by Real Clear Politics. So for now, and we’ll have our answer Tuesday, the election should leave the country with a standoff between Trump and the House.
In the currently favored scenario, Trump will get nothing that he does not negotiate with the Dems in the House. The markets won’t react positively or negatively based on that in my view, UNLESS the Democrats impeach Trump (impeachment is done by the House; trial by Senate). The downside of that would be 20-25%, if it compares to the Clinton December 19, 1988 impeachment.
2. China Trade War: This is the biggest ongoing trade war obviously. President Trump likely lied about the degree of progress that had been made with China on trade in order to goose the stock market directly, and make voters feel better. I say this because Larry Kudlow denied any real progress had been made just hours before Trump contradicted him. Larry is a pretty straight shooter. I’ve watched him since he was on Louis Rukeyser’s Wall Street Week, so I know what he’s about.
I believe the market is seriously worried about continued cost pressures on the U.S. economy secondary to the China Trade War and wants it resolved ASAP. It is an overhang, but it cannot be seen as an unsolvable impediment to market progress. Rather, it will cause some volatility, both UP as on Friday as well as DOWN as on Friday! But the trade war is NOT the top issue.
3. Earnings Growth Slowing: As I said last week: “The central reason the market is heading lower is because of the weak earnings and revenues expected for the SP500 Index companies in Q4 2018 to some extent, then accelerating into Q1 and Q2 of 2019.” This is still my answer and it has gotten worse! Here is why….
I just compared the FactSet published analyst projections into Q2 2019 made back in my 7-22-2018 issue which referenced their 7-20-2018 data to the current projections as of Nov. 2nd. Guess what? They are now WORSE than before. And they are likely to become even worse, unless there are upside surprises because global economic growth is slowing.
Here is the data (latest FactSet PDF for the Nov. 2 data below will open directly HERE):
7-20-18: For Q3 2018, analysts are projecting earnings growth of 21.6% and revenue growth of 7.5%.
Actual: companies are reporting earnings growth of 24.9% and revenue growth of 8.5%.
Relative performance: Earnings Growth = 15.3% HIGHER. Rev. Growth = 13.3% higher.
7-20-18: For Q4 2018, analysts are projecting earnings growth of 18.0% and revenue growth of 5.7%.
Now: For Q4 2018, analysts are projecting earnings growth of 15.0% and revenue growth of 6.8%.
Relative performance: Earnings Growth = 16.7% LOWER. Rev. Growth = 19.3% higher.
7-20-18: For Q1 2019, analysts are projecting earnings growth of 7.1% and revenue growth of 5.5%.
Now: For Q1 2019, analysts are projecting earnings growth of 6.0% and revenue growth of 6.6%.
Relative performance: Earnings Growth = 15.5% LOWER. Rev. Growth = 20.0% higher.
7-20-18: For Q2 2019, analysts are projecting earnings growth of 10.4% and revenue growth of 4.7%.
Now: For Q2 2019, analysts are projecting earnings growth of 6.5% and revenue growth of 5.1%.
Relative performance: Earnings Growth = 37.5% LOWER. Rev. Growth = 8.5% higher.
As you can see, earnings growth expectations between that 7-20-18 report and the 11-02-18 report have fallen considerably, which means stock prices have to adjust.
Some of that adjustment is accounted for in the fall to date of 7.41% from the all time high for the SP500 Index. But how much? No one can tell you, but realize that if the expectations have declined, they may continue to decline, because you’ll note that revenue expectations are HIGHER now than they were in July.
Why are revenue growth rates higher while there is global slowing? Is higher pricing on goods expected or more unit sales? The former creates inflation.
Can companies grow unit sales when global economic growth is slowing? I believe the SP500 Index revenue numbers will have to be lowered, and then earnings estimates will also be lowered, further lowering the earnings growth rate of the SP500 Index. Lower E’s, mean PE’s are higher than they should be, and stock prices fall.
What about oil? Oil is now in a downtrend and is only a problem for energy stocks. I pointed that out last week and oil broke to a brand new low, with gas prices falling just before the election! Well done!
There is one more lurking threat to the market: Last week I said: “The 4th reason for a bad break [in the market]: ‘A rate spike of the 10 Year Treasury Yield above 3.248% (without the oil spike) for ANY REASON would induce a further leg down in the SP500 Index and in mid caps and small caps as well of course.’“
This week’s reports showed wage inflation was a bit hotter than expected at 3.1% vs. the 3.0% expected and employment was warm too at 250K vs. the 190K expected, but the latter numbers are very volatile from month to month. The 10 Year Yield finished the week higher however at 3.214% close to the lower high of 3.215%. I still believe a spike above 3.248% would be taken badly by the stock market.
By the way, I bought some 7 month Treasuries on Friday after the spike, exactly because I believe the 3.25%ish rate top will hold. They were paying 2.52% annualized yield to maturity. Not great, but better than a savings account for cash holdings (close to cash at least). They can be readily sold if I want to deploy more cash into stocks.
Last week I said: “If Apple fails to please investors, ‘Master Market’ [the five year old boy the market truly is] will likely throw a big fit, especially the NASDAQ and QQQs. I also said, “Apple is a stock that has not come off its top by much. They had better hit their numbers when they report on Nov. 1st. The market is saying they WILL hit their numbers. The mess in China (a big part of their growth is in China), India and elsewhere says they actually may miss their numbers.”
Apple in fact reported weaker numbers than expected in unit sales terms especially in the emerging markets and fell 6.63% on Friday. When Luca (CFO) said they no longer would report unit sale numbers, I immediately messaged that this would be taken badly. They say they are focused on their “ecosystem,” which is a nice way of saying, “We are going to squeeze revenue out of our existing customers, but not increase our device sales numbers by much.” Apple did not wreck the market, but the QQQ’s were down 1.56% while SPY was down a much more sedate 0.59% after the Trump tweet bounce on the China situation.
I shared how I have adjusted my equity exposure over this period of turmoil in last week’s issue. Please read it if you have not, because at the least, it will make you think about your risk management process.
Here’s My Bottom Line and you should reflect on whether it is going to be YOUR bottom line as well, or if you believe something different: (I hope you have data to back up your view, even if it starts with an intuition.)
We are not out of the woods yet. Given the growth slowing backdrop, I am not going to stay fully invested with the exposure I have in a full fledged up trending Bull market, which I call “100% of my max. exposure for a Bull market.”
I told you last week: “I am OK with my exposure level being between 75 and 85% roughly as I trade in and out of the bounces and trounces to come. This is not going to be a straight line. Manage your exposure level to a point you are comfortable with…”
So this week I moved UP my exposure as noted HERE based on the success of the current bounce to a higher level. I raised it because the election jitters will pass IF the GOP keeps the Senate, which looks probable. I also believe the China thing will pass, but Trump could make things much worse if he drags his feet. The “earnings thing” could limit gains to a bounce followed by a trounce. Bounces can be big however…
How high will the bounce go? As I’ve said before, I examine the market as it moves higher or lower. Levels and mav’s (moving averages) don’t mean anything except as rough guides. It’s how the market looks at these levels that matters to me. I bought more exposure on Friday, because:
- I am adding to SPY (Friday and two buys on 10-22) because that yellow line (chart below) held on a retracement test (and the market was behaving well). So far, so good. That sets up the market for a possible bounce to the 50 day moving average or so.
- I bought a REIT Friday (starter position, revealed in my room HERE). Do your own homework on the fundamentals. I do not claim to be a stock analyst. I focus mainly on market analysis looking at both technicals and fundamentals. I look for themes and then look for corroboration from various sources before buying individual stocks. I also listen to one or more earnings report calls and review the company fundamentals. In this case my main focus is on the behavior of the stock as a “Happy Floater” (beating the market nicely of late) IN THE CONTEXT OF rates falling from this level. I may ditch it summarily if it does not perform per my view of it now. It MUST beat the market in other words, or it’s OUT. If the 10 yr. yield move to 3.5%, I’ll be out of it most likely.
- I bought utilities XLU Friday, near the Friday low, as I believe rates are close to a peak, and utilities rally when yields fall.
- Earlier I added to both SPY and Disney, which is a “Happy Floater” too.
For those who missed my “New Rules” last week they are :
New Rules: Market Drawdown Levels of Note
“Dip” >3%-5%. “Correction” >5% to 15%. “Mini Bear” >15% to 25%. “Big Bears” are >25% (often rising to 50% or more for some markets).
Now let’s check in on two “Canary Signals” we’ve been following:
“Intel-igent Market Timing Signal” (Intel; INTC): Negative. Still a down trend. Look for a higher high to change that. Bounces in Bear markets (Bear for this stock) occur commonly back to key levels and then the stocks move down again. Short the rips, and cover on the dips. Or play the bounces long if you have the will to do it. (Reminder: INTC is our “tell” on 2nd half earnings in tech as noted HERE.)
Bank of America (BAC) Market Timing Signal: Negative. All you have is a tentative reversal above the July low. That’s a start, but as I believe rates are near a top, I also believe BAC will fall again, even if from the 50 or 200 day mav.
The 2017 channel line is in orange on the chart below…
Keep up-to-date during the week at Twitter and StockTwits (links below) where a combined 33,722 investors are following the markets with me…
Follow Me on Twitter® Follow Me on StockTwits®.
SP500 Large Cap Index (click chart to enlarge; SPX, SPY): Broke above the down trend line in magenta…
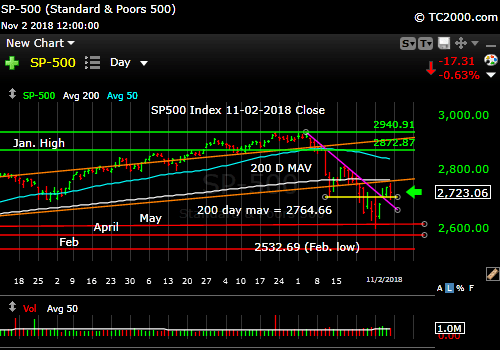
Bounce but to where?
Survey Says! Sentiment of individual investors (AAII.com) showed a Bull minus Bear percentage spread of +3.45% vs. -13.03%. This does not help much because the poll closed AFTER the bounce off the May low, so they were somewhat reassured. The prior low achieved was not low enough to call it a washout.
| AAII.Com Individual Investor Sentiment Poll | ||
| Bulls | Neutrals | Bears |
| 37.93% | 27.59% | 34.48% |
| Thurs. 12 am CT close to poll | ||
2. U.S. Small Caps Market Timing (IWM): Last week I said: “The February low (-3.38% away) is an easy target from here, but they’ll probably bounce when the large caps do if not lead the large caps up.” They fell to the higher of the two lowest days in February and bounced. And they led the SP500 Index, which is positive. They were up for the 4th day on Friday, while SPX was lower. The risk? They are the most volatile stocks and will do the worst if growth slows further than expected.
Russell 2000 U.S. Small Cap Index (click chart to enlarge; IWM, RUT):
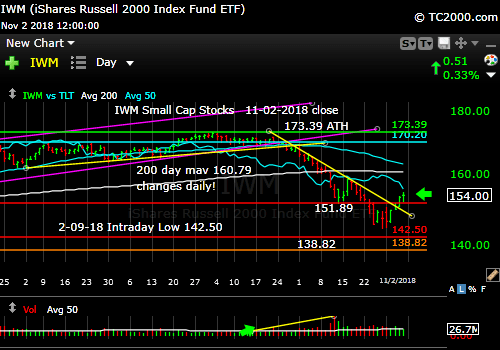
Tested one of two lowest days in Feb. and bounced.
3. Gold Market Timing (GLD): GLD pulled back and tested the prior breakout and passed the test. I had sold it just off the top, because I was anticipating a more negative reaction to the Friday data, which has not come yet.
If rates press up to 3.25%ish, gold will fall. Falling rates, which are on their way, will help gold. I think the market if front running that fall in rates and hence a fall in real rates. The problem is if Ex-US does worse than we do and there are more crises that pop up, the dollar will rally, which hurts gold UNLESS there is financial panic as I’ve said repeatedly. Google “When does gold shine and when does it decline?” Read that post please. Many of you have!
The Gold ETF (click chart to enlarge the chart; GLD):

Gold passed a test this week, and the market may be front running the fall in rates I expect.
4. Interest Rate Market Timing – U.S. 10 Year Treasury Note Yield (TNX):
You can see why I did NOT buy more Treasuries as TNX went down through 3.115%. It was on the basis of “Risk Off,” not rates falling under their own power to to speak. Rates are re-peaking now (that’s the hypotheis!). And rates must fall soon, or the rising rates will hurt stocks badly. The rest of the world DOES matter more than the Federal Reserve yet understands. Rates in the U.S. effect the entire globe, and have to be taken in the context of global rates, which are mostly very low to negative in most Ex-US developed countries.
Check out the “Market Signal Summary” below – after you review the following chart…
U.S. 10 Year Treasury Note Yield (click chart to enlarge; TNX, IEF, TYX, TLT, TBF):
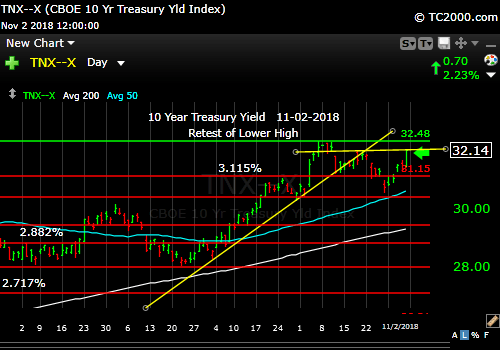
Trouble for stocks lies above 3.248%.
Now let’s review three key market timing signals together….
Do not use these signals as a trading plan. They are rough guidelines. I currently share my own moves on social media (links above).
MY MARKET SIGNAL AND TREND SUMMARY for a Further U.S. Stock Market Rally with Real GDP Growth (“Real” means above inflation):
Stock Signal RED for a further U.S. stock market rally with a BEARISH SP500 Index trend.
The VIX (which relates to SPX volatility) closed at 19.51 Friday vs. 24.16 the previous week.
I said two weeks ago: “Above 19.55, the VIX level is BEARISH for the SP500 Index, but rising to the 26ish level and then falling could be Bullish short term. The Bulls must retake the 8-15 high of 16.86 (break down below it). The ‘Bull Nirvana Target’ is our VIX # of the Year: 13.31. As I said 2 wks ago, ‘Super Bull Nirvana would be VIX below 11.22, but I have the feeling it will take a while to get back there.'” VIX 17.06 is the immediate Bull target. Then the nearby 16.86 etc.
Last week: “The Bears need to take out the 26ish top that was tested once again this week for the market to go into another leg of decline. If they do it soon, it COULD still just last a day or two.” It lasted a day and then the market bounced. VIX 28.84 is the Bear target for Armageddon (another big chunk of losses driving SPX down another 6.99% from the Friday close.
Gold Signal RED for a further U.S. stock market rally with a BULLISH Gold Trend.
From before: “Remember GLD is being used as an indicator for the ECONOMY here. I am calling it a BULLISH trend, because of both 1) the breakout above the prior trading range and 2) the stability in the face of rising dollar. GLD needs to break above 117.40 soon.” Still applies.
Rate Signal RED for a further stock market rally with a BEARISH 10 Year Yield Trend. The up trend is still broken until the lower high is exceeded (see above). Then all heck breaks loose for equities if TNX lurches above 3.248%, particularly if the rise is rapid.
I’m leaving this important statement here until things change: “This level of the 10 Year Treasury Yield, which is too high for current conditions as explained HERE, will eventually slow the economy.”
Sept. 28th issue: “A rapid push higher in rates would mean trouble for stocks, as occurred in early 2018.” That’s what I call “Rate Shock.” This period of rising rates is #RateShockII.”
Note: I’ve updated my criteria for the equity signal for a further U.S. stock market rally to the following: GREEN = Bullish, YELLOW = Neutral, RED = Bearish. In other words, the colors tell you whether the signal supports the stock rally or not, while the Bullish, Neutral, and Bearish designations are about the trend.
A BEARISH trend signal does not mean we should not buy. A BULLISH trend signal does not mean you cannot sell some exposure. It depends on what is going on in the economy and how oversold/overbought the market is at a given point whether the Bearish signal is to be sold, sold on the next bounce, etc. and whether a Bullish signal is to be bought or if profits should be taken. A NEUTRAL trend signal does not mean the end of the Bull or Bear. It means to wait and look for possible subsequent entry points within the existing trend, Bull or Bear, but preserve capital if the entry fails. Our strong intention is to buy low and sell high. By the way, I will keep showing the prior orange “Trigger lines” in the charts for now as reference points only; they have historical value for us from the post-2016 election period.
Thank you for reading. Would you please leave your comments below where it says “Leave a Reply”… or ask a question… Pay it forward too by sending the link to MarketTiming.Blog (that link will immediately connect them to this webpage) to a relative or friend. Thanks for doing that.
Be sure to visit the website for more general investing knowledge at:
Standard Disclaimer: It’s your money and your decision as to how to invest it.
I thank Worden Brothers for the charting system I use to post these charts. If you want to know more about the charting system I use every day, go to my “Other Resources” page here: Other Resources It makes it much easier to follow along with me if you can see the charts and manipulate them on your own computer. It’s a great investment to have an excellent charting system. Check it out with a free trial at the link above.
Finally: Please excuse and report all typos if you are so moved. I do my best to pick up most of them, but have not always found them all. Shoot me a comment (I don’t have to post your typo report as I filter them before publication, but I’ll be grateful to you!)
Copyright © 2018 By Wall Street Sun and Storm Report, LLC All rights reserved.
