A Market Timing Report based on the September 29, 2023 close
Market Timing Update for 10-22-23: Bond Buyers Needed…
Stocks won’t bounce much or at all, if the recent #RateShock keeps ripping…
The last three 10 Year Yield Highs have been…
4.996%
4.993%
4.993%
Around 5.000% on the 10 Year Yield seems to be where traders who were short longer term bonds and Treasuries were bailing, while others were buying last week. If that holds and rates ease from here, good, but if not, not so good…
The problem is the short term Opportunity Range™ for the 10 Year Yield is above 5.000% for Monday, but that puts Friday’s close at 43% in the predicted Monday range, and the range low is over 20 basis points lower. In other words, there is room to fall too, but bond buyers are needed for that to happen.
Newsflash! I don’t control the bond traders, so where they take the bond market is where it goes. All I can tell you is that the latest ramp has paused over the past two trading days and this is an opportunity for rates to pivot down. Again, that is if bond buyers show up! (rates go in the opposite direction to bond prices as many of you know)
With the Fed asleep at the wheel IMO (see week of 10-16-23 posts on social media), bond buyers are mostly on strike except for buyers of short term paper.
Note that the range for TNX, S&P 500 Index, or any other market timing candidate can be re-calculated intraday, but I’ve found it useful to note when it gets to extremes vs. the predictions based on prior data. Those can be trading opportunities.
There’s a caveat to that, meaning that using these ranges requires context. Crashing markets or exponentially rising markets cause the ranges to just keeps collapsing down (as small caps have at times during this long downtrend) or collapsing up (as interest rates have).
That is why I also pay attention to my buy and sell signals for the markets and also to my trend system changes (see the explanation of my trend system with its suggested trading guidelines at the tab in the navigation bar above)…
And now, back to the prior post…
The Big Picture
As before, wherever possible I’ll keep my commentary to reasonably short points, because what matters most are the market timing trends, not the narratives…
True Still? “The Fed is not done raising interest rates.” Or is it? I recently updated the projections for interest rate hikes and cuts on social media HERE. You can see that any cut is a long way off and the market believes the odds of just one more hike are around 30%.
They think that DESPITE rising Headline CPI Inflation, which includes food and energy, which we all consume, shown HERE and below…

Headline CPI Inflation rising
Source: TradingEconomics.com.
Headline PCE Inflation which includes food and energy as well as all other expenditures is also ticking up.

Headline PCE Inflation Rising
source: tradingeconomics.com
Core PCE inflation fell, however, which is what the Fed tracks. The problem, again, is the feed through of food and energy inflation to CORE inflation.

Core PCE Inflation Falling
source: tradingeconomics.com
That little upward hook at the end for Headline CPI and PCE Inflation is significant and is a problem for the Fed because Core CPI tends to eventually track PCE. As you will see below, the bond market agrees with me.
Inflation, whatever the category, causes businesses to raise prices as well as wages for their employees to retain them in the face of higher prices, which leads to more money in the economy meaning more inflation, at least when Fed policy is not restrictive enough to stop a wage price spiral upward.
The Fed thinks they will hit their 2% PCE Core Inflation target with current policy, but the fixed income market says “Wrong!” Rates would not be rising if they thought the Fed was on top of inflation. Powell is becoming a follower again. The prior episode of inflation was called “Transitory.” Transitory if you raise rates!
Next I want to review one of my updates from my last post and then point out what inflation and therefore the Fed may do to the stock market…
“My conclusion, which I shared on social media (HERE) is that we should reserve the term Bull Market for market up trends backed by economies that are strengthening, not weakening.
I am a writer by nature. Writers use words and they make them up along with useful terms. The current terminology around Bull and Bear markets is really, really dumb! This is a better way to think about markets…IMO!
In a Bull Market:
1. The market is in an uptrend.
2. Growth of the economy is accelerating.
In a Bear Market:
1. The market is in a downtrend.
2. Growth of the economy is decelerating.
If the market is moving opposite to the economic trend, then the market is simply in an uptrend or downtrend, but there is no Bull or Bear market when the economy is not aligned with the stock market. We could instead say, “The trend is Bullish (if it’s up), but the economy is Bearish (if it’s decelerating).”
There is another category of economy, which is stagnation with or without inflation or even deflation. If there is inflation, it’s called stagflation, which may be what we’re headed into now. It’s already where our manufacturing sector of the economy is today. Its growth is slowing and it’s suffering from inflation just like consumers. Inflation pressures business margins and profits drop. When the Es of PEs go down, the P’s or prices go down as stocks drop.
It’s expected now by some that the U.S. economy will be pushed into an outright recession by the Fed as it seeks to control inflation. It doesn’t have to be that deep either. I made that point many posts back.
In the 2000 crash GDP was barely below zero at -0.3% from peak to trough per Wiki. My assistant researcher Bard answered the question about the associated U.S. stock market decline. “The S&P 500 Index reached its all-time high of 1,552.87 on March 24, 2000. The intraday lowest low in 2002 was 768.83 on October 10, 2002. This represents a decline of 50.6% from the all-time high.” The answer was actually wrong by 01.%! It was a decline of 50.5% when rounded properly. I told Bard its math was sloppy.
Answer from Bard: “You are correct. My math was sloppy. The decline in the S&P 500 Index from the intraday price at the all-time high to the intraday lowest low in 2002 was 50.5%.
I apologize for the mistake. I am still under development, and I am always learning. I will try my best to be more accurate in the future.
Thank you for your feedback. It helps me to improve.”
OK, we’ll let it go this time… 😉
When markets are overvalued, the return to normal valuation when the economy slows is enough to chop stock prices down to size. That’s the risk of the upcoming stagflation if the Fed does not do it’s job.
Remember not long ago when they said that companies not making money and therefore making a yield on assets would be crushed by rising rates? They were crushed (look up Zoom’s chart on Yahoo Finance), but remember that ALL companies, even those making profits, are compared to what they refer to as the “risk free rate,” which is the 10 Year Treasury yield, which has been rising to new highs.
Short term rates are now, and have been for a long time, higher than long term rates, which is the inversion of the yield curve that has a very good track record in predicting recessions. Steep inversions lead to recessions. Many investors put their money where they can make an easy 5% or more vs. taking more risk with stocks. Stock prices come down as a result.
For example, say you have a son going to college next year and you can either leave your money for his 1st year tuition in the stock market as it’s declining or take it out and make about 5% on it, which do you do? Many would take their money out of stocks! Retirees may think similarly. They may decide to shift from their prior 60% allocation to stocks to a 30% allocation, particularly if they believe the market is going to fall.
The point for risk? Risk is elevated as long as inflation is perking up again, which means more Fed hikes, which means more competition for stocks.
That means having a normal Bull market allocation for stocks right now, unless you trade the swings up and down, entails higher risk.
Now we’ll look at the current charts, and see why this is one “level of interest” as I call them, where I thought it was worth adding back some exposure in a “rebalance” back to 60% of my usual exposure for a Bull market. That is my typical Bear Market positioning. If you want to allocate more than that, “you do you.”
Be sure to…
Follow Me on Twitter® Follow Me on StockTwits®. (real time messages are on StockTwits as always and back on Twitter)
Keep up-to-date and read my comments on the current setup during the week at Twitter and StockTwits at the above links) where a combined 36,345 investors are following the markets with me…
1. SP500 Index Market Timing (S&P 500 Index®; SPY, SPX):
In the last post here, I said, “You can see that the Aug. 2022 high did not contain this bounce. As discussed above, the higher we go based on a slowing economy, the greater the correction to come. I am not saying not to play this up trend. I’m invested in this up trend. I am saying to preserve profits on at least a portion of your exposure, should the trend reverse. You’ll see me lower my exposure when that time comes…” That was then!
I did lower my exposure on Aug. 17th, as shared on social media. I bought back about half of what I sold this past Friday, Sept. 29th. That brought me back to my Bear market exposure level.
I will add more for at least a trade IF I get my Buy signals (follow me on social media; Elon Musk has severed the automatic posting of posts on StockTwits.com to “X,” so the posts may be a bit delayed on Twitter (I’d follow both, in case of disruptions on either service).
How do you trade or invest at this point in time? You buy the “level of interest,” which is marked by the long term trend line coming up from the Oct. 2022 low (see lowest magenta line on 1st market timing chart below).
If you are a long term investor and don’t need the money for a while, you may choose to hold that “buy” despite further losses OR you use a stop somewhere below the line to get out of what you added. If you are pure trader, you will need to agree there is a chance for the level to hold. An investor could just see it as one level of discount off the prior high.
Decide what your risk tolerance is and given that, decide what you will do IN ADVANCE. There is nothing like the moment you are supposed to take a loss to protect your capital when the mind steps in and says, “You fool, don’t do it! If you book the loss it’s real, but if you don’t it’s just on paper and you don’t have to tell your spouse/sig. other etc.”
NOTE: As I expected, McCarthy had to make a deal that involved Dem help to keep the government open, which all great leaders are willing to do. Reagan passed many bills with Dem Speaker Tip O’Neill’s help. He did the right thing, which we need more of!
It is called compromise. The Senate still has to pass it as I write this up. It was not perfect (they excluded aid to Ukraine, which is not smart, because a Ukraine fall to Russia will lead to the Chinese takeover of Taiwan, which will cause massive chip shortages for our tech industry and shut down many other businesses. Poland and other former Soviet block countries would also be at risk, and an all out Third World War could be another consequence. Poland is a NATO member (since 1999), and we’re sworn to defend all NATO members.
The budget/debt deal, if passed as expected, may cause the U.S. stock market to bounce strongly on Monday barring other important news, which could stretch the market enough to make an entry more expensive. You could chase a bit perhaps, but then add more on the next pullback as long as the market remains a buy.
Click the market timing chart to see the details… (the lower RED arrow marks the October 2022 low)
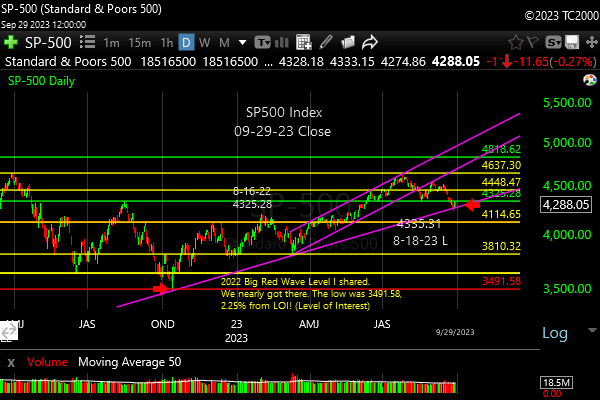
Inflection point or just a pause on the way to lower prices?
Now let’s review investor sentiment…
Survey Says!
The AAII Survey of Individual Investor Sentiment (AAII) spread is -13.1% (Bulls – Bears). That’s not a huge negative spread, but Bears hit a level not seen since May when the market was consolidating, and then moved up. That is somewhat supportive of at least a bounce here. What we really need to see is rates come down, as explained.
| Bulls | Neutrals | Bears |
| 27.8% | 31.3% | 40.9% |
| Thurs. 12 am CT close to poll | ||
Now let’s look at the small caps, gold, and interest rates…
2. U.S. Small Caps Market Timing – Russell 2000 U.S. Small Cap Index (click chart to enlarge; IWM, RUT)
Small caps are also in a position to hold a “gentle” or “weak” uptrend as noted by the lowest magenta line on the chart below. They may make a decent trade, but entail more risk in the near term.
Small caps will have more funding risk as rates are very high and likely to go higher. They are the worst performers too. IWM is down 27.70% from its ATH and SP500 Index is at -11.01%. I will continue to avoid small caps until we have what I call a “True Bull Market,” as discussed above.

Small cap “weak” uptrend line.
Gold is next…
3. Gold Market Timing (click chart to enlarge; GLD):
Last time we checked, I said…”Gold is in a “Consolidating UpTrend™,” which means a deeper correction vs. a “Correcting UpTrend™,” with the possibility of turning into a down trend.”
Gold is now in a DownTrend Type 1. See my update of DownTrend™s to two types, 1 and 2, two issues back (see table there). That’s 2nd from the bottom of the heap of all trends, but some investors may want to use a wider stop to the DownTrend™ Type 2 sell level (below the lower magenta line). Discipline says to “sell the bounces” from here until the trend changes if you do sell some or all of your position.
If rates start falling again, gold will recover, and you may want to rebuy that which you have sold. That’s trading life in a nutshell! If you get out at the wrong time, and it’s still a good company or trade, then get back in with a stop in mind.
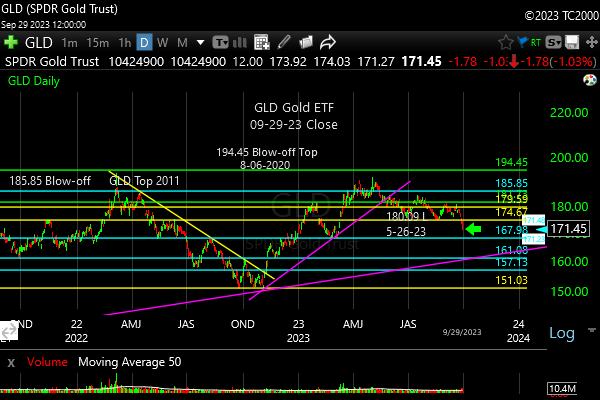
Gold has gotten weaker since our last look.
The best outcome for gold investors would be that the economy slows, interest rates fall anticipating Fed easing, and then the Fed eases causes real interest rates to fall.
4. Interest Rate Market Timing (10 Year Treasury Yield; click chart to enlarge; TNX, IEF, TLT):
This is what actually happened since this was written: “If the 10 Year Yield (shown below) climbs above that magenta line, we will be on the warning track. If it climbs above the red line, equities will likely finally start reacting to higher rates again after a long slumber of denial.”
The green line is 3.334%. The Yellow Line marks the lower high of 3.905%. The magenta line marks the slightly higher high of 4.091%. The red line marks the breakout line at 4.333%, which rates just exceeded!
This spelled trouble for stocks as explained in detail above!
The moral of the story is that the #Fed will have to follow the fixed income markets that are still downtrending due to rates rising. Unless rates ease, the Fed will be hiking again to play catch-up.
Here’s the current chart…

Rates rising still.
Now let’s review three key market timing signals together….
Do not use these signals as a trading plan. They are rough guidelines. I currently share my actual BUYS and SELLS in as timely a way as possible on social media (links above).
MY MARKET SIGNAL AND TREND SUMMARY for a Further U.S. Stock Market Rally with Real GDP Growth (“Real” means above inflation):
Stock Signal Bearish for a further U.S. stock market rally with a short term Bearish and longer term Bullish SP500 Index trend. The small caps determine the stock signal in this section of the report. And the longer term trend must hold as explained above!
Gold Signal Neutral for a further U.S. stock market rally. The Gold Trend is short term Bearish and longer term Bullish (see discussion above though). The Fed raising rates is a problem for gold AND stocks until the economy starts slowing in the case of gold, or until the market starts anticipating that happening.
Gold will take off again to the upside IF/WHEN 1. Rates start falling at the long end. 2. The economy slows 3. Earnings fall for stocks, which reduces the overall yield on stocks. Gold likes weak competition and particularly falling real interest rates, which also tend to weaken the US dollar!
As said before, “If real rates rise as the Fed acts, gold will be hurt, but in the short term, the Fed is hiking into economic slowing Y/Y, so that means rising short rates can LOWER long rates, which could help gold by depressing long term real rates.” But now that the Fed is pausing and rates are still rising at the long end, gold is being hurt.
Kept for Reference: “Gold can RISE with stocks when real rates are FALLING, and the dollar is falling. Gold could rise WITH the dollar if the economy slows and real long rates fall.
These are thing gold doesn’t like: 1. Rising real rates (bonds/Treasuries become a threat to gold which pays nothing; banks and other companies make more money with rising rates) and 2. Economic recovery with higher corporate earnings. Earnings drive stock prices higher. Stocks pay dividends that compete with bonds, and companies use cash to buy back stock, which drives up stock prices, while gold pays nothing.
In liquidity crunches (which the Fed is supposed to prevent) gold can drop with everything else but the US dollar.”
What gold does mostly as I’ve written HERE is follow real interest rates around the world (if you own “gold in dollar terms” you care about U.S. rates most of all). The rest of the world does matter however, including massive buying by central banks. Real interest rates have been rising around the globe. Economic slowing is creeping in now, which means ultimately real rates will fall again if the Fed suppresses growth.
GUIDE: “Remember GLD is being used as an indicator for the ECONOMY here.” If gold continues to rise again, it means the market believes real rates are going to fall or stay negative for a period of time.
Rate Signal: At this point Bearish for a further U.S. stock market rally, as rates have risen again. The 10 Year Yield trend is short term Bullish, and intermediate term Bullish.
(Remember: higher rates mean lower bond and Treasury prices and vice versa). We want slowly rising rates in a recovering economy. That’s what happens normally. The Fed raises rates slowly as the economy continues to grow until it doesn’t. What we don’t want is rapidly rising OR rapidly falling rates, both of which I call “Rate Shocks.” The Rate Shock we saw in 2022 was due to the Fed raising rates at the fastest rate since the 1980s.
Thank you for reading. Would you please leave your comments below where it says “Leave a reply”… or ask a question if you like…
Pay it forward by sending the link to MarketTiming.Blog (that link will immediately connect them to this webpage) to a relative or friend. Thanks for doing that. I appreciate it, if you took the time to do that!
Be sure to visit the website for more general investing knowledge at:
Standard Disclaimer: It’s your money and your decision as to how to invest it.
I thank Worden Brothers for the charting system I use to post these charts. If you want to know more about the charting system I use every day, contact me for any questions, or click HERE. Please use that link when you sign up as I am an affiliate (I don’t make much, but it may help to pay for some of my website expenses). It makes it much easier to follow along with me if you can see the charts and manipulate them on your own computer. It’s a great investment to have an excellent charting system.
Note: I’ve updated my criteria for the equity signal for a further U.S. stock market rally to the following: GREEN = Bullish, YELLOW = Neutral, RED = Bearish. In other words, the colors tell you whether the signal supports the stock rally or not, while the Bullish, Neutral, and Bearish designations are about the trend.
A BEARISH trend signal does not mean we should not buy. A BULLISH trend signal does not mean you cannot sell some exposure. It depends on what is going on in the economy and how oversold/overbought the market is at a given point whether the Bearish signal is to be sold or bought, sold on the next bounce, etc. and whether a Bullish signal is to be bought or if profits should be taken. A NEUTRAL trend signal does not mean the end of the Bull or Bear. It means to wait and look for possible subsequent entry points within the existing trend, Bull or Bear, but preserve capital if the entry fails. Our strong intention is to buy low and sell high. By the way, I will keep showing the prior orange “Trigger lines” in the IWM and GLD charts for now as reference points only; they have historical value for us from the post-2016 election period.
Copyright © 2023 By Wall Street Sun and Storm Report, LLC All rights reserved.
