A Market Timing Report based on the July 26, 2024 close…
UPDATE for the 9-27-2024 Close: “SP500 Index Sector Market Timing Trend Classification”
| XLB | XLC | XLE | XLF | XLI | XLK |
| UT | UT | CDT | CORUT | UT | CONUT |
| XLP | XLRE | XLU | XLV | XLY |
| CORUT | CONUT | UT | CONUT | UT |
See the tab at the top for a key to the trend classification system (“UT” etc.), and what to do about each trend type. The red final letter means there is a topping formation or some other risk to buying at the current price.
For XLE, the green letter in the trend type means there is a “risk” of a positive bounce from the current consolidation. The trend shown is usually a negative trend class.
UPDATE for 9-16-2024: The Number of Federal Reserve Rate Cuts Could Be as High as Six Now (1.5% in total)
I didn’t think the rate prediction market would shift during the two days preceding the Fed’s FOMC meeting. On Friday 9-13, the odds of a 0.50% vs. a 0.25% cut on Sept. 18th was 50%:50%.
The CME data as of today says a 0.50% rate cut is 63% probable and 0.25% 37% probable. That means the market could be upset either way by the September rate cut, or at least screw up positions on both sides of that.
And it also hints at (doesn’t prove) a leak by the Fed of what the cut will be. The Fed is in a blackout period. No one was allowed to speak publicly as of Sept. 7th until Sept. 20th, a day after the FOMC meeting on Wednesday. There is an unproven rumor that they leak information through the Wall Street Journal (Google AI agrees with that statement – it’s an unproven rumor). During a blackout period a leak is the only way for them to signal the markets. Remember, it’s just a rumor.
As my loyal readers know I believe, the Fed will not make the same mistake twice if it can help it, which is why they should cut by only 0.25%. The Fed’s “Transitory” inflation call was an embarrassment to them, and it was the main cause of the inflation that occurred in my opinion. That’s what happens when the Fed goes to sleep on fiscal stimulus. The legislature and president decide tax and fiscal policy. The Fed is supposed to keep inflation under control no matter what the legislature and president decide. They could have done so. They did not… Interest rates go up, but inflation does not, when the Fed is on the ball in pushing back on the monetary impact of fiscal policy. It’s their job!
UPDATE for 9-09-2024: How Many Fed Rate Cuts Will We See by December 2024?
Per the CME Fed Tool, there is a small 9-15% probability of 6 cuts of 0.25% (0.50% X 3) by the December 18th meeting.
1 cut in this summary = 0.25%
At the other extreme….a small probability exists for just 1 cut of 0.25% per meeting for a total of 3 cuts by December.
The market agrees with me that the first cut will be 0.25% (73% odds) on Sept. 18.
The majority probability (53.2% + 15.4% = 68.6%) is 3-4 cuts by the Nov. 7 meeting.
That won’t happen if inflation perks up again.
The majority (40.2% + 38.0% = 78.2 %) probability is 4-5 cuts by the December 18th meeting. (1, 1, 2) or (1, 2, 2).
What to Consider: This will have a big impact on short term rates, so you may want to lock in some 1-2 year Treasury rates or longer with the cash you won’t need over that period of time.
I’ve also been adding IEF, IGIB, and municipal bonds in taxable accounts as you can see on my social media stream.
If you want more leverage on rates, you can consider TLT as well. It will rise more and fall more depending on the direction of rates as compared to IEF, IGIB, etc.
The Rate Risks?
The issue will be if inflation picks up again toward the end of the year, which some of my sources believe will happen. That will drive bonds back down somewhat, as the Fed cuts come more slowly or even stop.
Once the Fed starts cutting, they tend to cut multiple times, so slowing over the next few meetings would be more likely than stopping, unless the data make a sharper turn than expected.
UPDATE for 8-13-24: Will We See a Redo of 7-11 on 8-14?
It was a lucky day (7-11!), because the CPI report satisfied the market that the Fed can start to lower interest rates from what they consider a restrictive level to a less restrictive one.
What do my indicators say about what could happen tomorrow at 8:30 am ET?
My short term indictors are mid-range, but have an upward bias.
My Key Fast Indicators are on the verge of signaling a shift, for the Fast Sell Indicator to OFF and the Fast Buy Indicator to ON. That must be followed by the slower Buy/Sell Indicator turning from SELL to BUY, which takes a couple of days to confirm.
But last time, the post-CPI move was 2/3 over by the time the slower Buy/Sell indicator kicked in as a Buy, so it’s potentially worth adding some exposure in advance of the report/move, and adding further if the prediction is confirmed by the data.
How you do that is up to you, if you want to game the CPI report. You might add 1/4 to 1/3 ahead of time and add another 1/4-1/3 if the response is positive, and the rest on a positive close. That’s just an example, but “you do you.” If you are risk adverse, just wait for the CPI results and add slowly. Use a stop in case the initial reaction sours…
Small caps are particularly interesting, because while ITB has held up above the prior low before the big bounce starting on 7-11, small caps (IWM) retraced the ENTIRE gain and then some down to the 200 day moving average.
But look at where the IWM consolidation is today. It’s a bit higher than the gap between 7-10 and 7-11. I believe that is a hint that the market is still somewhat positive about the possible impact of lower interest rates on small caps.
Rates falling FAST vs. Rates Falling Slowly: Rates only fall fast when the #Fed is panicking and trying to catch up with a rapidly weakening market. They may stick with 0.25% rate cuts each meeting this time around UNLESS unemployment shoots up dramatically and job creation falls rapidly.
But EITHER WAY, rates are going to move down at some point over the next few months. The market sees the first cut at the next meeting in September and several more after that.
And guess what? Almost regardless of what small caps do, as long as rates come down, housing stocks (ITB) should benefit. That’s what the above analysis tells you. Small caps are a bet that rates will come down with a STRONGER economy over time, while the housing sector will do well if there is modest slowing of the economy with lower rates. A big fall in the economy will lead to new lows in BOTH. A more modest slowing that we are now seeing could keep small caps flat with housing prospering, particularly in the non-starter home range.
That’s my risk management summary of trading ITB and IWM into the CPI report…
IN SUM: The set-up is neutral, but with an upward bias. Whether this is a Bull trap, or an opportunity to trade the same range as before in all of the ETF’s I mention below, we will find out tomorrow…
Back to the main post….
Back in April I led with the 2024 Election Mess as the top risk, and finally it has come home to roost, but despite that, any selling will be an opportunity in my view, and other opportunities are now taking shape…
I stand by this:
Number 1: The 2024 election is going to be a mess. This will create a buying opportunity in stocks.
I previously said, “A felony conviction could tank Trump with Independents, and defeat him.” This has not proven correct so far, because voters may either be waiting for sentencing or not care about the offense involved, but now that Biden is out of the race, it may have impact, especially if he is given “incarceration time,” which may be “anklet time” when he’s sentenced on Sept. 18th. [UPDATE 9-09-24: Not happening. Judge Merchan will not sentence Trump until after the election at the end of November.]
I don’t believe the SCOTUS immunity ruling will impact the NY trial, because paying a porn star off can’t be taken as an “official act” of a president. I do believe Trump may only receive “Weekend Anklet Time,” because he is running for office, and that is a possible choice the judge may make. Will that change any votes? Maybe it would at the margin if he were sent to jail, which I consider unlikely.
It’s unclear whether ANY of the other trials are going to occur even in part before the 2024 Election. If Trump wins, he’ll be able to hire an AG who can dismiss his federal cases. That may not be ethical, but it’s not illegal.
And now there is a stronger candidate challenging Former President Trump, namely, V.P. Kamala Harris. Politics aside, she has had on the job training as V.P., and she’s mentally equipped to debate him, which Biden sadly was not. The point here isn’t who the better choice is; it’s that the election is now a toss-up, whereas before, Trump was headed to victory nearly unchallenged, or so it seemed…
Despite the eventual outcome of the November election, the markets could correct further, given the fact that they are adverse to uncertainty.
Also still true…
Volatility increases into presidential elections historically, and higher volatility means lower stock prices.
Volatility spiked this past week with a score off my “game board” as I call it (a rating system of the level of SPX Volatility).
The VIX Volatility Game Score™ with VIX = 16.39 is at Bulls 3 vs. Bears 5 (8 points total). The Bears still have the edge…
Still holds:
“Markets hate uncertainty. They trade DOWN on uncertainty, and given the amount of it, it would seem unlikely that we’ll avoid a 10-15% drawdown prior to the election. I profited nicely from the “election jitter play” during the last two cycles, and I intend to make money on the chaos this time too!”
Number 2
The economy is slowing a bit, but should reaccelerate into the end of the year. Stocks could continue to pull back on the temporary weakness in this quarter.
Number 3: “Interest rates need to move down from here…”
Interest rates rose to a recent high on Oct. 23, 2023 of 4.997% as you can see in the fourth chart below. This was a threat to stocks, particularly those needing new capital to replace loans coming due or to expand their businesses. This impacts small caps the most, biotech that needs new capital regularly, and also large companies that have taken on too much debt.
NOTE: Stay up to date by following me on social media, because the market is moving fast enough that my advice may change quickly. That’s what happens when volatility picks up. Things move faster…
For now rates are falling as the TNX 10 Year Treasury Yield Chart shows below. That helps interest rate sensitive investments rise. Here are a few examples…
- Bonds and Treasuries (LQD, IEF, VGLT, TLT, and muni bonds)
- Small to Mid Caps (Small: IWM and Mid: IWR, IJH) with the smallest companies getting the biggest boost as you see in the IWM chart below. (see the update above before you invest)
- Home Builders (ITB): I invested in ITB on the day the CPI was released and am up considerably despite the “chase” that buying involved. When there is a catalyst for either an index, a sector, or a company, you may have to chase to enter a market. Waiting for a pullback can mean buying a big stretch. That was true last October as you see in the SPX and IWM charts, and it was true again for IWM just in the past couple of weeks.
ITB is volatile in BOTH directions, so please read my update on 8-13-24 above… - Biotech (IBB): I’ve entered this market as well. Biotech often needs cash to expand or even create new businesses around new discoveries, so they are interest rate sensitive. This is a brand new breakout… (higher risk; see the update before investing)
- Utilities (XLU; see 7-26-25 post on 3 ways to buy Utilities): I entered this past Friday. Any company with a sizable dividend yield will benefit from lower rates, as it means less competition vs. the dividend rate it offers investors.Remember that EVERYTHING sells off in a big market decline. There is no safe place except Bonds/Treasuries under current market and economic conditions. If inflation rises, they are at risk – again. Tricky, huh? 😉 The key is being flexible…I don’t expect anything over a 15% decline in the SP500 Index before the election, unless the Fed is forced to stand pat on lowering rates for example, meaning inflation starts rising again.
A reminder before we go to the charts…
I combine 3 systems for market timing, which are:
1. My “Opportunity Range™” calculations on short term trading ranges help me pick better spots to add and reduce exposure to both ETFs and individual stocks. When I place trades, I’ll often quote the position of the given ETF in the range on social media (links below).
2. My “Market Trend Timing System™” helps me enter and exit major trends earlier than I otherwise would.
3. My “Market Indicator Panel™” helps me time the big market moves in stocks. This panel of indicators has enabled me to make significant market calls repeatedly. I share these signal changes on social media…
To be up to date on my latest insights and buys/sells, be sure to…
and…
Real time messages are on StockTwits™ as always and appear a bit later on X/Twitter (following me on both ensures that you have a backup to get my posts btw, when one may be down).
Keep up-to-date and read my comments on the current setup during the week on StockTwits™ and X™ at the above links) where a combined 36,814 investors follow the markets with me…
1. SP500 Index Market Timing (S&P 500 Index®; SPY, SPX):
We have had new all time highs in the S&P 500 Index and the move down to the low last Thursday, July 25th was a 4.21% down move.
That’s less than a correction in my “slip naming system,” so to speak (my approach for naming drawdowns is HERE – Search the page for “New Rules”)
Given the uncertainty around who our next president will be, I expect more of a drawdown between now and the election as said. Whether it will continue to hurt large caps much more, while small caps and other previously beaten down stocks continue to hold up at least somewhat, better remains to be seen. In big drawdowns EVERYTHING falls together, but given the state of the economy, I don’t expect such a decline, even if everything falls for a time, to be too deep.
Notice that the SP500 Index has weakened in steps, although it’s still making new highs, first falling below the “1” uptrend line. And then it reached a new high as you see.
Now it is already testing below the “2” up trend line.
It could continue to fall to the “3” horizontal line, which would be around where a longer term trend line intersects (4, which is beneath that line).
Finally, it could go as low as testing the 200 day moving average (mav), and test below it as it did last year as you see on the left side of the chart.
So what do I do with all of those possibilities? I call them “#LevelsOfInterest.”
I wait for my market timing buy signals to go off, hopefully with support from the Opportunity Ranges™! Right now those signals are on the verge of giving another BUY signal.
Stay tuned on social media for timely updates. I’ll be checking them Monday morning to see if they have changed from negative to positive…
Click the market timing chart to see the details…
The long term trendline (4, magenta line) is below the current price, but the short term trendline of this rally (2, magenta and slanted upward) has been breached.
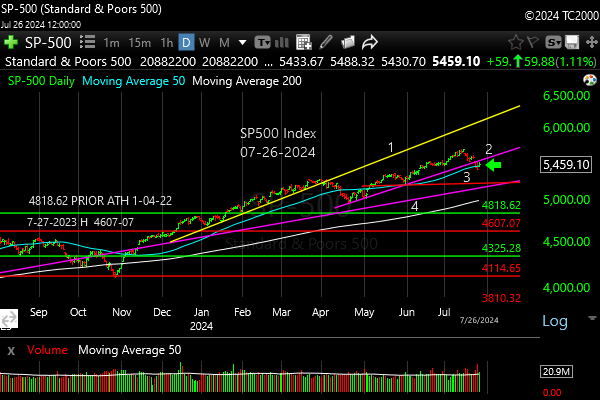
The S&P 500 Index is an an uptrend, but it has dipped!
Now let’s review investor sentiment…
Survey Says!
The AAII Survey of Individual Investor Sentiment (AAII) spread is +11.4% (Bulls – Bears; AAII figure considers numbers with two decimal points, which is why is isn’t 11.5%). That means there is room for upside or downside from here, and it’s not a great help beyond showing there is a lack of an extreme.
Sentiment topped out with the Bulls at 52.7% and the Bears at 23.4% on July 17th, when the market just started to come down (it was the 1st down day in this “Slip”).
On April 24th, the market was the least Bullish since 2-28 with Bulls at 32.1% and a spread of only -1.8%. Big drawdowns, as in 2022, create -43% spreads. In the Oct. 2023 drawdown, the spread was only -26%.
This move doesn’t even count as a correction yet, but it could end up being one.
| Bulls | Neutrals | Bears |
| 43.2% | 25.1% | 31.7% |
| Thurs. 12 am CT close to poll | ||
Now let’s look at the small caps, gold, and interest rates…
2. U.S. Small Caps Market Timing – Russell 2000 U.S. Small Cap Index (click chart to enlarge; IWM, RUT)
We finally have an uptrend in small caps. If the economy softens more than expected, the rally may stall or reverse, but given the expectation of both rate cuts in September (and again in Nov. and Dec. perhaps), as well as the growth acceleration expected in revenues and earnings in the latter half of the year, I think the uptrend may hold up.
Click the chart to see the details better…
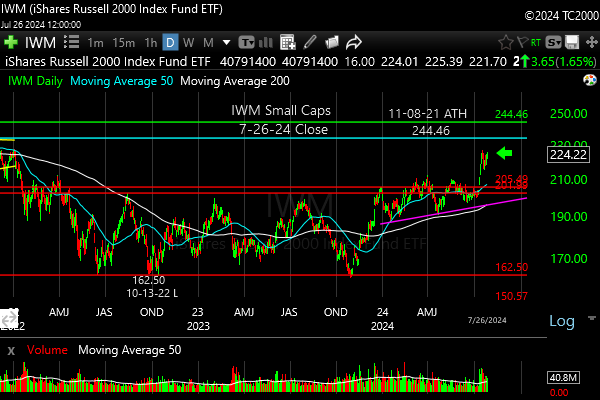
Small cap uptrend!
Gold is next…
3. Gold Market Timing (click chart to enlarge; GLD):
In April I said, “Gold is in an uptrend that appears to be currently overextended.”
When a market is stretched, it can either pull back or go sideways to relieve the overbought condition. It mostly went sideways…
The following chart is the weekly chart to show you the big picture for gold, which has been consolidating. That’s how it’s overcoming the prior level of stretch.
As long as it doesn’t cut down through that top yellow line (2nd from top) at 210.71, the rally should resume…

Gold’s in an uptrend still.
4. Interest Rate Market Timing (10 Year Treasury Yield; click chart to enlarge; TNX, IEF, TLT):
In April I wrote: “Stocks will need rates to start moving lower again very soon, or this rally will take a pause or more likely fail.”
Rates started falling immediately after I wrote that in the following week.
Dear Market, Thanks for responding to my post! 😉
Several cuts, the number of which depend on the course of inflation, are expected in 2024, starting in September.
Rates should continue to fall, barring a resurgence of inflation, which should not happen per my sources until Q4 2024 into 2025, depending on how many rate cuts we get from the Fed, as well as the course of the economy.
Here’s the current chart…
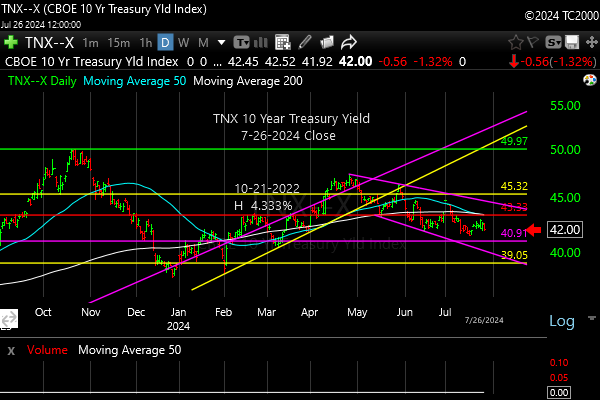
The 10 Year Treasury Yield has been falling since April 26th.
Now let’s review three key market timing signals together….
Do not use these signals as a trading plan. They are rough guidelines. I currently share my actual BUYS and SELLS in as timely a way as possible on social media (links above).
MY MARKET SIGNAL AND TREND SUMMARY for a Further U.S. Stock Market Rally with Real GDP Growth (“Real” means above inflation):
Stock Signal Bullish (this signal looks at small caps, so large caps could fall behind due to valuation concerns) for a further U.S. stock market rally with a short term Neutral and longer term Bullish SP500 Index trend. The small caps determine the stock signal in this section of the report. And the longer term trend must hold as explained above!
Gold Signal though technically Bearish for a further U.S. stock market rally, is less Bearish due to the power of falling interest rates, which is the current trend. Stocks AND gold both like lower rates.
The Gold Trend is short term Bullish and longer term Bullish as it’s above its longer term trend (see discussion above).
Gold will take off again to the upside IF/WHEN 1. Rates start falling again at the long end (10 years or longer). 2. The economy slows 3. Earnings fall for stocks, which reduces the overall yield on stocks. Gold likes weak competition and particularly falling real interest rates, which also tend to weaken the US dollar!
Kept for Reference: “Gold can RISE with stocks when real rates are FALLING, and the dollar is falling. Gold could rise WITH the dollar if the economy slows and real long rates fall. Money leaves stocks and moves into the US Dollar and gold.
These are thing gold normally doesn’t like: 1. Rising real rates (bonds/Treasuries become a threat to gold which pays nothing; banks and other companies make more money with rising rates) and 2. Economic recovery with higher corporate earnings. Earnings drive stock prices higher. Stocks pay dividends that compete with bonds, and companies use cash to buy back stock, which drives up stock prices, while gold pays nothing.
In liquidity crunches (which the Federal Reserve is supposed to prevent) gold can drop with everything else but the US dollar.”
What gold does mostly as I’ve written HERE is follow real interest rates around the world (if you own “gold in dollar terms” you care about U.S. rates most of all). The rest of the world does matter however, including massive buying by central banks. Real interest rates have been rising around the globe.
GUIDE: “Remember GLD is being used as an indicator for the ECONOMY here.” If gold continues to rise again, it means the market believes real rates are going to fall or stay negative for a period of time.
Rate Signal: At this point Bullish for a further U.S. stock market rally, as rates have been falling. The 10 Year Yield trend is short term Bearish (falling now), and longer term Bullish (meaning RISING over the longer term). This is a DownTrend Type 1™ in my system of trends (see tab at top).
(Remember: lower rates mean higher bond and Treasury prices and vice versa). The economy is slowing somewhat under higher Fed Funds rates, and now the market is anticipating rates falling again. We generally want slowly rising rates in a recovering economy, but that won’t happen when the economy is slowing down. Normally the Fed raises rates slowly as the economy continues to grow until it doesn’t. What we don’t want is rapidly rising OR rapidly falling rates, both of which I call “Rate Shocks.”
The Rate Shock we saw in the stock Bear Market of 2022 was due to the Fed raising rates at the fastest pace since the 1980s.
If you see them crash Fed rates lower, look out for a recession! They only react that fast if they see one coming.
Thank you for reading. Would you please leave your comments below where it says “Leave a reply”… or ask a question if you like…
Pay it forward by sending the link to MarketTiming.Blog (that link will immediately connect them to this webpage) to a relative or friend. Thanks for doing that. I appreciate it, if you took the time to do that!
Be sure to visit the website for more general investing knowledge at:
Standard Disclaimer: It’s your money and your decision as to how to invest it.
I thank Worden Brothers for the charting system I use to post these charts. If you want to know more about the charting system I use every day, contact me or them for any questions, and click HERE. Please use that link when you sign up as I am an affiliate (I don’t actually make much, but it may help to pay for some of my website expenses). It makes it much easier to follow along with me if you can see the charts and manipulate them on your own computer. It’s a great investment to have an excellent charting system.
Note: I’ve updated my criteria for the equity signal for a further U.S. stock market rally to the following: GREEN = Bullish, YELLOW = Neutral, RED = Bearish. In other words, the colors tell you whether the signal supports the stock rally or not, while the Bullish, Neutral, and Bearish designations are about the trend.
A BEARISH trend signal does not mean we should not buy.
A BULLISH trend signal does not mean you cannot sell some exposure. It depends on what is going on in the economy and how oversold/overbought the market is at a given point whether the Bearish signal is to be sold or bought, sold on the next bounce, etc. and whether a Bullish signal is to be bought or if profits should be taken.
A NEUTRAL trend signal does not mean the end of the Bull or Bear. It means to wait and look for possible subsequent entry points within the existing trend, Bull or Bear, but preserve capital if the entry fails.
Our strong intention is to buy low and sell high.
Copyright © 2024 By Wall Street Sun and Storm Report, LLC All rights reserved.
