A Market Timing Report based on the October 18, 2024 close…
UDPATE 1-17-2025: “What Has to Happen Now in the US Stock Market?”
This is a sneak preview on my next blog post, which will appear on this site by this weekend…
What we don’t want to see is a bunch of lower highs develop, the most obvious of which today is IWM that is green (+0.64%), but is still below the high of the broad consolidation range that followed the 12-18 swoon.
I’ll post the chart in the upcoming blog post. But if you look at a chart of IWM while reading this, you’ll see that at first IWM broke the base of that consolidation and then it climbed back inside it.
But now IWM has so far failed to break out, at least on the attempt today. No bueno!
If we don’t see continued uptrends and in the case of IWM, that breakout, the market could turn down into a Wave 3 Down, which is what I call the “Big Red Wave.” Barron’s online site quoted that term I made up for the Wave 3 Down, when I called the December 2018 decline.
Pointing out a similar pattern in the 2000-2003 Tech Market crash that rivaled the Great Depression (-78% for the NASDAQ), and warning investors online saved them large chunks of retirement and/or education savings money I was told. This won’t be that big if it were to happen in the current context, given the state of the economy and other factors, but I never say never.
I’ll share the potential risk (how big a drop could occur) for the SPX and IWM this weekend on the next blog update. It should be out by Sunday evening most likely.
UPDATE for 1-12-2025: Bounce or Trounce Ahead?
Notice how none of the major indexes is in crash mode yet based on closing prices. When the market crashes, the trading range is exceeded on the downside, sometimes by 20% or more. That can happen in either direction, and I refer to it as “pressured buying.” When the breaches are big, I could legitimately call it “panic buying/selling.”
The following is based on the closes on 1-10-2025…
Pr. = Predicted Low and High short term trading range numbers for today. U/D = Upside to Downside.
|
% vs. ORange™
|
At Price = | Pr. Low | Pr. High | U/D | |
| $SPX | 19% | 5827.04 | 5,785 | 6,002 | 4.16 |
| $QQQ | 27% | 507.21 | 500.96 | 524.41 | 2.75 |
| $RUT | 17% | 2,169 | 2,282 | 2,189 | 4.79 |
| $TNX | 94% | 4.763 | 4.610 | 4.772 | 0.06 |
| $GLD | 87% | 241.82 | 241.82 | 249.30 | 0.15 |
While the range behavior is OK, that doesn’t mean the selling will necessarily stop. Interest rates need to stop going up for that to happen IMO. That means at least stabilizing or, more optimally, dropping. My Fast Signals are discrepant. The Fast Buy Signal has risen into the danger zone, which would indicate another down leg for the US major indexes. The Fast Sell Signal has not. My Short Term Indicators also did not deteriorate in a way to indicate that second leg down will appear. That’s a mixed picture.
The close of the SP500 Index below the low of the current consolidation of 5829.53 today at 5,827.04, raises concern, but it’s what I call a “cute close,” because it’s only 2.49 points lower. The tech heavy QQQ ETF closed above the 505.71 low of 1-02-2025 at 507.19, which shows some relative strength.
What I have not been adding to is IWM, which closed near its 200 day moving average at a brand new recent low. It has bounced a bit from the intraday low, although it is still at a point below the prior consolidation (where it went sideways).
Could all three indexes rally from their current lows? Of course, but I would expect interest rates to behave as noted above before they do.
UPDATE for 1-08-2025: “The US Stock Indexes Are At a Decision Point: The Next US Stock Market Move”
The 10 Year Yield is down just 0.2 basis points today or 0.002%. It must stop its rise.
The lower US 10 Year Yield high in April 2024 was 4.737%. We’re at 4.677%, after getting to 4.716%, so getting close, and perhaps close enough.
If TNX rises above that April high? We’d likely see a 2nd leg down in all major US indexes.
But… My indicators are back where they were when the prior recent lows were achieved, matching the indexes, which are back at the prior lows more or less.
Take a look at QQQ…
https://www.tradingview.com/x/5N3wzOQw/
You can see it’s revisiting the prior lows. So are SPY and IWM, with IWM the weakest, but also rebottoming.
The markets have two choices and no one can seriously tell you which will occur. Those are guesses. If my indicators become more extreme than they are now, we will be headed to new lows. If not, prepare for a decent bounce. If you put on new exposure here, either use a fairly tight stop on it, or be prepared to hold your nose, should we head lower.
If employment on Friday is weak as ADP was, the market may be concerned about a weak economy and sell stocks, or will they buy Treasuries, driving rates down and give stocks a boost? We’ll find out at 8:30 am Friday…
Stay tuned on social media (links below), because I’ll share whether my indicators indicate a bounce vs. another leg down…
12-31-2024 Update on Opportunity Ranges™
A snapshot at about 11:10 am. Pr. = Predicted short term trading range numbers for today. U/D = Upside to Downside.
The ranges are broken if there is panicked buying (chasing) or panicked selling. No one can predict what the market will do when a wrench being thrown into the market.
When markets are trending without panic, they tend to trade between the lows and highs of the ranges. If the trend is up, the point is to buy the slips to the middle or low end of the range, depending on what the market offers!
|
% vs. ORange™
|
At Price = | Pr. Low | Pr. High | U/D | |
| SPX | 53% | 5902 | 5,789 | 6,006 | 0.90 |
| QQQ | 46% | 513.85 | 502.98 | 526.42 | 1.16 |
| RUT | 66% | 2,164 | 2,275 | 2,238 | 0.51 |
| TNX | 48% | 4.551 | 4.471 | 4.636 | 1.06 |
| GLD | 72% | 236.70 | 236.70 | 244.27 | 0.40 |
11-13-2024 Update: ORange™ Ratings for 11-14-2024: See the right most tab at top to read about this rating system…
This is the rating scale (I had to compress the list for it to fit, so the categories are read from top down as in “- N” and “- B” etc. :
| – | – N | – B | N – | N | N B | + Cor | + N | + |
| -4 | -3 | -2 | -1 | 0 | 1 | 2 | 3 | 4 |
The order of appearance is irrelevant. The category they are in is not.
4 = IWP IWR TNX UUP BTC XLE EWS EWC
Most buyable, but strong uptrends like these can correct and that’s when you add until you don’t!
3 = SPX SPMO QQQ
Buyable on slips until they are not.
2 = RUT IBB IWO SMH KWEB KLIP EWJ IIM (IIM is a leveraged muni ETF; it will suffer if rates keep climbing)
Small caps and these others are weaker, but the 2 rating means they could resume their rally. At least it’s more likely than with a -4 rating!
-4 (The weakest short term trading trend)= GLD GDX HEDJ FEZ VGK INDA EMXC
Where these stop, nobody knows. I’ve sold all foreign exposure except KWEB and KLIP at this point. Reduced GLD as indicated on my social media feed (in % exposure left). Sold GDX and SIL as well. I have one small gold mining position left that is close to its stop.
-3 = ITB XLU XLRE IEF IGIB
The N means they are all consolidating and could go either way. But the trend in TNX is a +4, very strong! All of these are interest rate sensitive investments. No coincidence that they share similar weakness.
11-03-2024 Update: Opportunity Ranges™ for Monday November 5, 2024. These are short term trading ranges based on the Friday close. Sometimes they persist for a few days, but can change daily too.
Where they start the day in the range based on the closing prices on the prior trading day are shown in the 2nd column from the left. They don’t tend to matter unless they are very low or very high. The behavior in the range during the day is what I watch most closely.
Being at the low in the range for the day can sometimes mean a quick bounce and a profit (if booked!) the next day, but sometimes those bounces don’t come right away or persist more than intraday, as you are well aware. When a market is crashing for example, the bounces quickly give way to even lower lows.
The behavior OFF the low or high for the day matters, as does penetration of the lows or highs of the predicted ranges. Range penetrations when large indicate pressured buying (panic buying) or pressured selling (panic selling), and often lead to more of the same. However, if selling has been going on for days, it can die out and give way to a bounce, even if short in duration and magnitude.
We can expect the ranges to be violated during this election week! But in which direction? What is actually baked in? We can guess, but I follow the market and my signals rather than guesses, whether mine or those of others.
Finally, it’s always wise to consider the daily and even intraday charts (1 min, 15 min, 1 hour for ex.) along with the range behavior, before trading or investing…
Pr. Low = Predicted Low for the day
Pr. High = Predicted High for the day
U/D = Upside/Downside
|
% vs. ORange™
|
At Price = | Pr. Low | Pr. High | U/D | |
| $SPX | 42% | 5728.80 | 5,666 | 5,815 | 1.37 |
| $QQQ | 52% | 487.43 | 478.45 | 495.87 | 0.94 |
| $RUT | 46% | 2,174 | 2,252 | 2,210 | 1.16 |
| $TNX | 76% | 4.361 | 4.154 | 4.427 | 0.32 |
| $GLD | 36% | 250.03 | 250.03 | 256.76 | 1.76 |
Back now to the main post…
Back in April I led with the “2024 Election Mess” as the top risk, and it did come home to roost in April, July, and August into September declines, but the pullbacks were relatively shallow ones…
The 2024 election could become a bigger issue if the standing of the two candidates shifts in the polls. So don’t be shocked by yet another pullback in the U.S. stock market prior to November 5th, or even after the election should Trump lose and attempt to cause trouble again. He’s already saying that if he loses, the election WAS rigged. Who buys that nonsense?
None of the trials are in play prior to the election, because Trump’s lawyers are better at delaying trials than they are winning them. He’s already lost the hush money trial, been found liable for rape, and been found to be a business fraudster who ripped off banks and insurance companies to get cheaper loans and lower insurance rates.
This still holds: “Volatility increases into presidential elections historically, and higher volatility means lower stock prices.”
At the close Friday, the VIX was just above 18, close to stepping onto what I call the Bull Game Board, but not quite there yet. I expect it to be back above 20 before Election Day.
The economy is slowing a bit, but should reaccelerate temporarily by early 2025. Growth is still strong on a percentage basis in earnings and revenue, even though the comparisons year over year show some slowing. The market has as a whole looked past the periods of slowing, although individual companies not meeting their numbers have taken a beating.
FactSet says, “For Q4 2024, analysts are projecting earnings growth of 14.2% and revenue growth of 5.1%.” That is very strong, and can continue to support stock prices, particularly for larger companies if interest rates push still higher. Smaller companies have a harder time raising money from the markets when rates move higher, which they have (see the TNX chart below).
The 10 Year U.S. Treasury Yield rose to a recent high on Oct. 23, 2023 of 4.997% as you can see in the fourth chart below. The 10 Year Treasury Yield then fell to 3.603% and then bounced to 4.073%. The market is telling the Fed it may have made an error in lowering the Fed Funds rate by 0.50% last month.
A reminder before we go to the charts…
I combine 3 systems for market timing, which are:
1. My “Opportunity Range™” calculations on short term trading ranges help me pick better spots to add and reduce exposure to both ETFs and individual stocks. When I place trades, I’ll often quote the position of the given ETF in the range on social media (links below).
2. My “Market Trend Timing System™” helps me enter and exit major trends earlier than I otherwise would. Read the explanation of my system using the tab link at the top of this page…
3. My “Market Indicator Panel™” helps me time the big market moves in stocks. This panel of indicators along with technical analysis has enabled me to make significant market calls repeatedly. I share these signal changes on social media…
To be up to date on my latest insights and buys/sells, be sure to…
and…
Real time messages are on StockTwits™ as always and appear a bit later on X/Twitter (following me on both ensures that you have a backup to get my posts btw, when one may be down).
Keep up-to-date and read my comments on the current setup during the week on StockTwits™ and X™ at the above links) where a combined 37.067 investors follow the markets with me…
1. SP500 Index Market Timing (S&P 500 Index®; SPY, SPX):
We have had further new all time highs in the S&P 500 Index, despite three separate pullbacks. If the trend remains up, I recommend staying long, and adding stocks and indexes that are better priced and in uptrends.
Please click on the chart to enlarge it…

It’s a Bull Market.
You can add some exposure to the SP500 Index on pullbacks, but realize at some point the current extreme valuations will require “payback.”
That may happen in a smaller and BUYABLE way prior to the election, and then in a bigger way in 2025 when growth expectations are not met. Q1 2025 looks OK for now. At some point, you’ll see me lowering my exposure to US stocks, other global markets, and even gold.
The current S&P 500 Index price is 3.44% above the breakout level, which is the prior 2022 all time high (ATH).
But you also see that the price is above the prior long term uptrend line that marks the top of the up channel (magenta line #3 above). Each time it’s risen above that line, it has corrected. It is also crawling up the most current upper channel line (#5). Don’t be shocked if you see it pull back from the extremes.
Now let’s review investor sentiment…
Survey Says!
The AAII Survey of Individual Investor Sentiment (AAII) spread is +20.1% That means there is room for upside or downside from here, and it’s not a great help beyond showing there is a lack of an extreme. However, the last time the numbers were similar was on Oct. 2nd, and a rally followed that day.
| Bulls | Neutrals | Bears |
| 45.5% | 29.2% | 25.4% |
| Thurs. 12 am CT close to poll | ||
Now let’s look at the small caps, gold, and interest rates…
2. U.S. Small Caps Market Timing – Russell 2000 U.S. Small Cap Index (click chart to enlarge; IWM, RUT)
We also have an uptrend in small caps. You can see in the chart that IWM is testing the prior highs and the top of the channel as well.
If it manages to make and hold a new high above those highs, I’ll be a buying on small pullbacks.
Click the chart to see the details better…

Small Caps are also in a Bull Market.
Gold is next…
3. Gold Market Timing (click chart to enlarge; GLD):
We’ve been long gold in both long term hold and trading terms for a long while now. It’s been a great addition to a diversified portfolio, despite the fact that many money managers oddly avoid it. I’m at my maximum exposure for a Bull market in gold. It is nearing the top of the current channel, which is not the best place to buy.
Please click the chart to enlarge it…
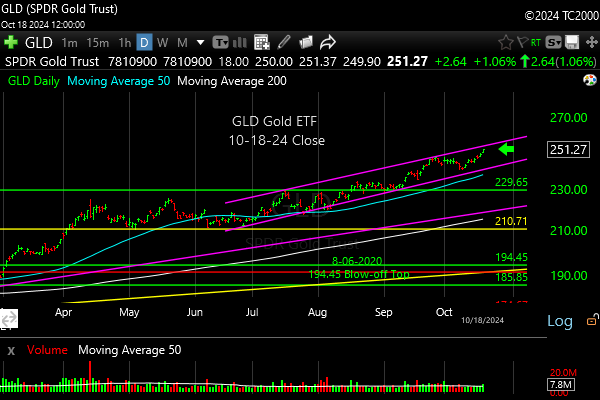
Gold is also in a Bull market.
4. Interest Rate Market Timing (10 Year Treasury Yield; click chart to enlarge; TNX, IEF, TLT):
Longer term interest rates have not continued falling, even though the Federal Reserve cut the Fed Funds rate by 0.50% last month. Interest rates have been rising again along with inflation that will likely show up in the next CPI report.
The big bounce in interest rates is thumbing its nose at the Fed. They should have followed my advice and the market’s to not lower rates by more than 0.25%. They cut by 0.50%, as if it were an emergency.
Rising rates in the bond market and rising commodity prices other than oil are telling them to “go slow,” so expect a cut of only 0.25% at the Nov. 6-7th Fed FOMC meeting. Cutting 0% is not a likely outcome unless the inflation numbers are seriously bad prior to the meeting, because the Fed doesn’t like to stop and start an interest rate cutting or hiking cycle. This is supposed to be a rate cutting cycle…
Rates could soon take a pause from the recent bounce, because TNX is nearly at the 200 day mav (grey line), and it almost up to the upper down channel line shown in the chart. In fact, one could argue that rates are still in a downtrend longer term, while bouncing currently over the short term. The path of inflation will determine the path of TNX from here…
Here’s the current chart. Please click on the chart to enlarge it…

Rates rising at least in a major bounce.
Now let’s review three key market timing signals together….
Do not use these signals as a trading plan. They are rough guidelines. I currently share my actual BUYS and SELLS in as timely a way as possible on social media (links above).
MY MARKET SIGNAL AND TREND SUMMARY for a Further U.S. Stock Market Rally with Real GDP Growth (“Real” means above inflation):
Stock Signal Bullish (this signal looks at small caps, so large caps could fall behind due to valuation concerns) for a further U.S. stock market rally with a short term Bullish and longer term Bullish SP500 Index trend. The small caps determine the stock signal in this section of the report.
Gold Signal though often Bearish for a further U.S. stock market rally, the further rise is due to the overall impression that rates are going to come down, however slowly, around the world. Falling rates mean lower real interest rates, which gold loves.
The Gold Trend is short term Bullish and longer term Bullish (see discussion above).
Gold takes off again to the upside IF/WHEN 1. Rates start falling at the long end (10 years or longer). 2. The economy slows 3. Earnings fall for stocks, which reduces the overall yield on stocks. Gold likes weak competition and particularly falling real interest rates, which also tend to weaken the US dollar!
Kept for Reference: “Gold can RISE with stocks when real rates are FALLING, and the dollar is falling. Gold can rise WITH the dollar if the economy slows and real long rates fall. Money leaves stocks and moves into the US Dollar and gold.
These are thing gold normally doesn’t like: 1. Rising real rates (bonds/Treasuries become a threat to gold which pays nothing; banks and other companies make more money with rising rates) and 2. Economic recovery with higher corporate earnings. Earnings drive stock prices higher. Stocks pay dividends that compete with bonds, and companies use cash to buy back stock, which drives up stock prices, while gold pays nothing.
In liquidity crunches (which the Federal Reserve is supposed to prevent) gold can drop with everything else but the US dollar.
What gold does mostly as I’ve written HERE is follow real interest rates around the world (if you own “gold in dollar terms” you care about U.S. rates most of all). The rest of the world does matter however, including massive buying by central banks. Real interest rates were rising around the globe, and now they are starting to fall in many nations.
GUIDE: “Remember GLD is being used as an indicator for the ECONOMY here.” If gold continues to rise again, it means the market believes real rates are going to fall or stay negative for a period of time.
Rate Signal: At this point Bullish for a further U.S . stock market rally, as rates have been falling at least over the longer term. The 10 Year Yield trend is short term Bullish (in a bounce) and longer term Bearish (falling rates over the longer term).
(Remember: lower rates mean higher bond and Treasury prices and vice versa). The economy was slowing somewhat under higher Fed Funds rates, and now the market is anticipating rates falling again. We generally want slowly rising rates in a recovering economy, but that won’t happen when the economy is slowing down. Normally the Fed raises rates slowly as the economy continues to grow until it doesn’t.
What we don’t want is rapidly rising OR rapidly falling rates, both of which I call “Rate Shocks.”
The Rate Shock we saw in the stock Bear Market of 2022 was due to the Fed raising rates at the fastest pace since the 1980s.
If you see them crash Fed rates lower, look out for a recession! They only react that fast if they see one coming.
Thank you for reading. Would you please leave your comments below where it says “Leave a reply”… or ask a question if you like…
Pay it forward by sending the link to MarketTiming.Blog (that link will immediately connect them to this webpage) to a relative or friend. Thanks for doing that. I appreciate it, if you took the time to do that!
Be sure to visit the website for more general investing knowledge at:
Standard Disclaimer: It’s your money and your decision as to how to invest it.
I thank Worden Brothers for the charting system I use to post these charts. If you want to know more about the charting system I use every day, contact me or them for any questions, and click HERE. Please use that link when you sign up as I am an affiliate (I don’t actually make much, but it may help to pay for some of my website expenses). It makes it much easier to follow along with me if you can see the charts and manipulate them on your own computer. It’s a great investment to have an excellent charting system.
Note: I’ve updated my criteria for the equity signal for a further U.S. stock market rally to the following: GREEN = Bullish, YELLOW = Neutral, RED = Bearish. In other words, the colors tell you whether the signal supports the stock rally or not, while the Bullish, Neutral, and Bearish designations are about the trend.
A BEARISH trend signal does not mean we should not buy.
A BULLISH trend signal does not mean you cannot sell some exposure. It depends on what is going on in the economy and how oversold/overbought the market is at a given point whether the Bearish signal is to be sold or bought, sold on the next bounce, etc. and whether a Bullish signal is to be bought or if profits should be taken.
A NEUTRAL trend signal does not mean the end of the Bull or Bear. It means to wait and look for possible subsequent entry points within the existing trend, Bull or Bear, but preserve capital if the entry fails.
Our strong intention is to buy low and sell high.
Copyright © 2024 By Wall Street Sun and Storm Report, LLC All rights reserved.
