A Market Timing Report based on the 12-07-2012 Close published Sunday December 9th, 2012
UPDATE 12-11-2012 @ 9:41 am: We’ll get back to the emerging markets below. For now, take a look at the US dollar vs. the metals to see what’s done best since the election. I plotted the US dollar index (UUP) against GLD (orange line) and SLV (yellow line). Silver has done the best. Interestingly I think there is a shift toward “Euro Confidence” which may be more of a lack of confidence in the U.S. until we get our fiscal house in order. The Euro is up strongly today with the dollar and the metals down.

Silver has been the winner since the election.
Stocks are up as well even in the US, so the so called risk trade is on.
EWG (Germany) is close to making a new major monthly high today. I’ll let you know via Twitter today when I pull the trigger on that trade. Note that there is risk on the first two or so days after a breakout, so be willing to exit if the breakout fails. NOTE: Added at 10:01 am as I said on Twitter.
UPDATE 12-10-2012: GLD has now formed a bottom as shown in the most current chart below. You can compare that to the chart at the link below. Short of Euro panic resuming, the US dollar will have to weaken from here to support a further gold rally. That it will do so is not entirely clear as the US dollar index just made a higher daily low (see chart below gold chart). So if you buy GLD here, consider using a stop!
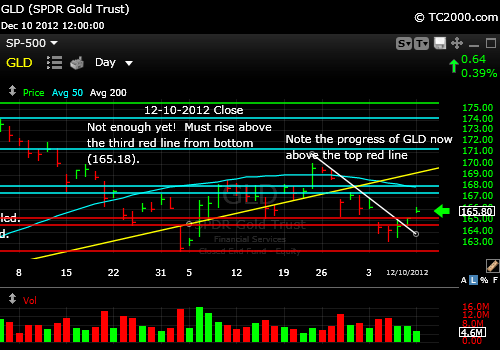
The GLD ETF is bouncing from an important low.

US Dollar Index needs to fall to support the gold
rally unless Europe panics again.
Now for this week’s issue (with added comments on the emerging markets w/ chart):
Since the election, the Emerging Markets (VWO, EEM) are leading both US Small Caps (RUT) as well as US Large Caps (SP50o Index) as the chart shows:

Emerging markets lead as shown.
The loose money in China, Japan, and the US among other countries is fueling the emerging markets. China’s economy is responding. Even Japan’s stock market is breathing in new life, and we’re now 100% invested in our Pacific Rim holdings.
The Russell 2000 Index (RUT, IWM) is close behind, but as of 12-07-2012 is pausing just above the 50 day moving average as shown in this week’s Bonus Chart of the Week (see link below for all charts).
Market Timing Charts for Sunday’s Issue are Here (opens separate window so you can access all the charts at once)
Not coincidentally, the SP500 Index (SPX,SPY) chart shows that we’re now just barely above the 50 day moving average. So the large caps are pretty much in step with the small caps in market timing terms, while lagging a bit in overall gains since the election. There is resistance just above here at 1423.73 and then at the Nov. high as shown on this weeks SP500Tracker™ Chart (see link above for chart).
You’ll have to be pretty nimble to capture gains between those two points, so the next easier buy would be above the early Nov. high of 1434.27, while still using a stop. If the market goes straight up to there, it is more likely to fail than succeed there at this time.
The VIX was falling a bit on Friday, which is bullish, but it must drop below the August through October lows to allow a brand new recent high in the market to occur. I would guess that it may hit the Oct. or Nov. high prior to that given the political stalemate in DC.
What about investor sentiment? The AAII survey states that the Bulls rose from 40.93% to 42.22% and Bears barely rose from 34.36% to 34.60% and the spread moved up minimally to 7.6% from +6.0% since last week. This once again, makes some level of retest more likely.
And metals? Gold (GLD) has bounced from a higher low, which is positive, as shown on this week’s GLDTracker™ Chart (see link above for all charts).
If you are underexposed to metals, this is an averaging in point. You can use a stop in case the current base does not hold. The dollar rally remains an issue for gold as mentioned above. Only if full Euro panic takes hold will you see gold and the dollar rallying together strongly.
Answering “Mail”: A Twitter follower of mine asked in regard to the pullback in GLD: “Is this due to Blackrock saying miners need better reporting, FCX buying another co. and GS saying Gold going lower?” I replied that the way price moves is to mirror the sum total consciousness (thinking) of the market around the given stock/ETF/commodity/currency. The equation is incredibly complex, so decision making must in the end be intuitively based. Intuitive decision making will bring you to more correct answers.
Incidentally, I teach a method of raising investor decision making consciousness in a one-on-one format. If you are interested, please contact me for a free strategy session to see if my course would be a good fit for you.
The summary this week is that many markets are at perfect places to fail. At the same time, some markets, like emerging markets, continue to be favored and are making new highs above key resistance levels. The Bulls have not lost the ball yet, but without key decision making in Washington, D.C., their days are likely numbered. The pullback may not be severe, because the backdrop is an improving U.S. economy, albeit slowly!
Standard Disclaimer: It’s your money and your decision as to how to invest it.
The above is the text from this week’s free report. To receive future reports ahead of publication of the text shown above AND much more market timing information, please subscribe for free here:
Free Subscription to My Weekly Newsletter
If you “liked” this post, would you please “Like” it at the “Share” arrow below? Thanks very much!
And to follow my Buys and Sells and up to the minute insights, please follow and bookmark my Twitter feed here: Join Me on Twitter
Copyright © 2012 By Wall Street Sun and Storm Report, LLC All rights reserved.
