A Market Timing Report based on the 12-14-2012 Close published Sunday December 16th, 2012
UPDATE 12-19-2012: Two charts explain why the QQQ (NASDAQ 100 “Big Tech” index is now a trading buy and probably also an intermediate term buy (see the two Twitter links to right side of page please to view the charts. If you do not see them, go directly to my Twitter page to open them immediately (click the link at the bottom of the page).
UPDATE 12-17-2012: What a difference a day makes along with a few suggestive positive comments by two politicians. Comments by President Obama and Speaker Boehner were enough to move the SP500 Index (SPX,SPY) back up toward that early November high of 1434.27, now about 4 points away. If we move quickly up to that level or the December high of 1438.59, the market may decide it has taken enough risk on until a deal shows up in the flesh.
It appears that the market is starting to build momentum ahead of a deal. The trouble for the Bulls may be that a “sell the news” mentality develops along with more selling before the higher tax rates kick in next year, so it may be best to average up as we go higher and protect profits. Here is where the market ended the day:
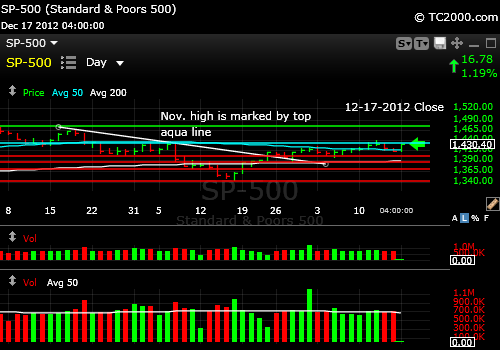
November high is the first target and it is just overhead.
And now this week’s issue out on Sunday….
The markets are teetering. Well, U.S. markets are. I told you to favor emerging markets last week, and the world continued to drive up their prices. The emerging markets and the European market are holding their breakouts still, which is impressive. Chinese economic activity is on an upswing again. The Chinese know how to goose their markets too. When Europe is being taken as a better bet than the US markets, you know there is some sort of serious trouble! Luckily I scaled out slowly last week from the European markets while exiting a number of U.S. ETF’s. (I am maintaining some core holdings like Berkshire Hathaway that I bought at around $68/share during the 2011 summer swoon, but I’m out of all the U.S. ETF’s. UPDATE 12-17-2012 Close: Back in small cap growth (IWO, RUO) and mid to large cap growth (IWF, RLG) on 12-17-2012. Will add back other positions after further progress as indicated. See my tweets for more details.)
Remember that the world’s other markets will likely pull back if the U.S. selling gets out of hand, but they’ll hold up relatively better.
Before I get to the numbers, it is critical to realize which numbers we need to look at and why. As some of your know now, the numbers on most charts are not corrected for dividends, so if you look at an ETF, the older data misrepresents the actual value of the ETF vs. today’s price. The current price is corrected for the dividend because the market price drops on the ex-dividend date fairly consistently unless there is other news that prevails, but the old prices on most charts are NOT corrected for the subsequent dividend distribution.
One place to find such dividend corrected data is on Yahoo’s historical data pages. Some charting systems do the correction and others do not. For example, the VWO dividend corrected high on 9-14-2012 was 43.15 not the 43.69 shown on many charting systems. We are still above that high, so the breakout is intact as shown on the chart:
Emerging Markets Chart (VWO): See the Bonus Chart of the Week here: Market Timing Charts for Sunday’s Issue are Here (opens separate window so you can access all the charts at once)
On the other hand the SP500 Index is back below the 50 day moving average, having failed to rise above the November high and stay there last Wednesday. The VIX has made a higher low and moved up on Friday, so it’s poised for a further rally (which means a SP500 sell-off).
It was all about the Federal Reserve on Wednesday. Some said that the reason the markets reacted negatively rather than positively to the statement was because the actions they took were already baked into the price. It was thought that they’d not only continue with the mortgage backed securities buying to inflate the housing market, but also buy more Treasuries when the current program expires, and they indeed included both in their statement. That means $45 billion for the repurchase of Treasuries, so they can extend the average holding period for the Treasuries they own on the Fed balance sheet as well as the $40 billion they are spending on rebuying mortgage-backed securities (packaged mortgages sold by the lenders). That is an $85 billion monthly bill!
There is more and more talk of the potential unintended consequences of the Fed magic show. The only reason we can do this while other nations like Greece suffer is because our currency has the number one reserve status in the world. The great twist of fate would be that we lose the US dollar’s reserve status BECAUSE of these sorts of antics. We cannot fake our value as a reserve currency country except for brief periods of time. Inertia of the financial system protects us to some extent, but not forever. Even Chairman Bernanke spoke about how the actions the Fed is taking have no historic precedent, so we’re doing a science experiment on the world’s economy. History teaches us that you cannot create wealth through deception. Is the Fed no better than Bernie Madoff’s company that worked its accounting magic on depositors’ money? I’ll leave that to you and history to decide. I say it won’t end happily for investors who fall asleep on their assets.
Remain conscious and follow the charts, not what “they say,” and you’ll do much better than your bond buying lemming neighbors who have been hypnotized by the Chairman. Paraphrased but fully accurate in content: “You are better off even though you are being paid no interest, because your house is becoming inflated in value and so are your stocks.” He actually said that at one of the recent Fed question and answer sessions. He admitted the Fed is a thief that is stealing from the responsible to save the irresponsible. Meanwhile, all that money that is not being paid to us in interest is going into the banks’ pockets.
The other action the Fed took is to get rid of all the “dates.” They will no longer refer to target dates when discussing when the Fed funds rate will go up or when Treasury buying programs will stop and instead will point to guidelines like an unemployment rate below 6.5% and inflation above 2.5% to guide them. These are not “automatic” in the sense that the Fed. Reserves the right to ignore those trigger points. So they have no system is what they are saying. Remember Fed history is bound to be repeated. Alan Greenspan was notoriously too loose with the money supply, which led to the housing mortgage crisis in the first place.
So getting back to the markets themselves, the SP500 Index is tipping down back below the 50 day moving average and may drag European and Emerging Markets with it as show on the chart (see link above for all the charts).
What would be the easiest and most powerful resolution for the Bulls? It would be the completion of a reverse head and shoulders formation which is simply an upside down head, the 11-16 low, and two upside down shoulders, which would be the 10-26 low and a new low now to match it, yet to be formed. The low on 12-05 which was 1398.23 would be an alternative low during the pullback. The positive resolution of this inverse head and shoulders, if it forms, would be for the SP500 to close above 1438.59. That move would propel the market back to 1531 or so, still below the 2007 high which was 1576.09.
The issue is that we’d need robust economic growth as well as fiscal responsibility to get us there. The reason that the stock market could drop severely on resolution of the fiscal cliff is that if the cutbacks in government spending are too severe, GDP will fall due to the drop in such spending, which has supported tech companies throughout this crisis – until now! So fiscal responsibility can quickly become fiscal poison for the economy.
Gold (GLD) has bounced but needs to hold the most recent daily low as shown on the chart (see link above for access to charts).
Silver (SLV) looks weaker than gold at the moment, because it has yet to drop to the Nov. 2nd low, although it is still ahead of gold (GLD), since the election.
A side note: my call on municipal bonds (e.g., see PZA) this week (to sell) was correct. The profit taking has deepened. I wonder if big players know that municipal bonds won’t be touched in the agreement that has not yet been reached! I bet that is the case. The cities can’t afford having Washington mess with their money supply.
Investor sentiment would predict based on similar patterns back in August 2012 that we’ll move down slightly to that 1398-1403 level and then rally, perhaps fulfilling the target of the reverse head and shoulders formation. The AAII survey Bulls rose from 42.22% to 43.23% and the AAII Bears fell from 34.60% to 30.08% and the spread moved up from 7.6% to 13.2% this week.
In conclusion, look for a pullback to the 1400ish level for the SP500 Index. If you see the market supported there, it could be a very good holiday season for the Bulls. If that level breaks, watch out below.
Standard Disclaimer: It’s your money and your decision as to how to invest it.
The above is the text from this week’s free report. To receive future reports ahead of publication of the text shown above AND much more market timing information, please subscribe for free here:
Free Subscription to My Weekly Newsletter
If you “liked” this post, would you please “Like” it at the “Share” arrow below? Thanks very much!
And to follow my Buys and Sells and up to the minute insights, please follow and bookmark my Twitter feed here: Join Me on Twitter
Copyright © 2012 By Wall Street Sun and Storm Report, LLC All rights reserved.
