A Market Timing Report based on the 12-21-2012 Close published Sunday December 23rd, 2012
UPDATE 12-27-2012: The SP500 Index in market timing terms is just above the two nearby support levels of the 12-14-2012 low of 1411.88 and the 50 day moving average now at 1412.84. I doubt this base will be breached before we know what happens in regard to the fiscal cliff. Have a look at the weekly chart as well which is referenced in this week’s report (see below).

SP500 Index Support is nearby and should hold at least until the fiscal cliff question mark is removed.
Above chart showing most recent data at “high power.”
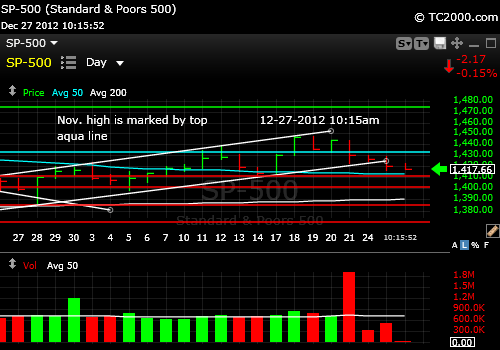
Higher magnification of SP500 Index chart shown above (10 min later).
UPDATE 12-25-2012: The 12-24-2012 close was still below the critical Nov. 2012 market timing high discussed below in this week’s newsletter, but it is above the base of the upward channel marked by the white lines in the chart below. Perhaps fiscal sanity will rule following Christmas! A break below that channel line will bring us to 1400 in a hurry as mentioned last week.
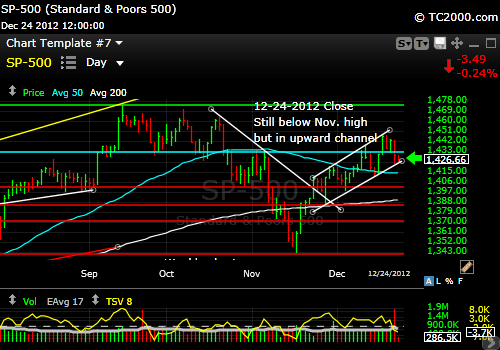
SP500 Index below the critical Nov. 2012 high, but still hanging on at the base of the up channel.
The markets as I said remain vulnerable to screw-ups in Washington. They seem to have a knack for it too! We’ll allow them to act like adults whenever they finally make that conscious choice, even though recent comments are hardly convincing of this as a likelihood. Senator Reid insulted Speaker Boehner rather directly last week and then referred to him as “my friend.” With friends like that, well, you know how that saying ends! There are just a few days left prior to the cliff, so perhaps the Mayans were just off a couple of days? It won’t be that disastrous, although it certainly poses a challenge to investors. The market’s volatility shot up from the lows but was a bit contained on Friday.
The VIX (VIX volatility index) shot up to test the range that has prevailed through the late summer and fall and then failed to make a new breakout high. That is positive and suggests the US stock market has not yet given up hope for a resolution in Washington. The other positives include the new high make by the Dow Transports, the firming of the energy group of indices, and strengthening of REITs and banks since last week. So all is not glum.
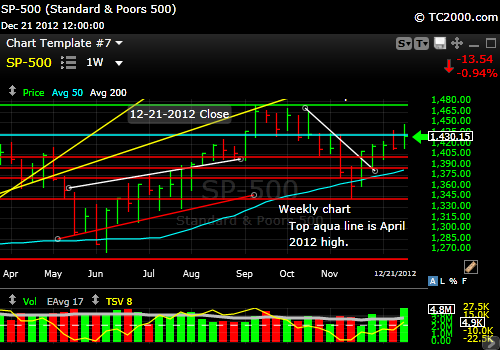
Still, the November SP500 Index (SPY, SPX) high remains the market’s sticking point as shown explicitly in this week’s chart:
Market Timing Charts for Sunday’s Issue are Here (opens separate window so you can access all the charts at once)
What about sentiment this week? I posted the brief summary on my AAII page this week here:
http://www.sunandstorminvesting.com/aaii-survey-review-investor-sentiment.html
Please read my conclusion at the end of this report though too.
What about interest rates? Are they supportive of stocks? “Yes for now” is the best answer. The stock market does not need rate competition from Treasuries, so it’s best if rates stay below the lid of around 1.85% shown on the chart (see Bonus Chart of the Week chart link via the link above).
My prediction that the lid would hold was correct.
And what of gold? With all the central banks running their currency printing presses at full steam, even the Japanese doing so in the latest leadership shift, gold should be rallying right? Yes, over the long term it should, but for the short term there is less in the way of Euro panic, so less money goes into gold and more shifts out into Euros. And other than the fiscal cliff, the U.S. economy seemed to be doing better which means more competition for gold too. However, I do not believe that the long term picture for gold has changed YET. What will change it is an increase in real interest rates that is significant and that should not happen if the 10 year Treasury stays below that 1.85% cap. Above there and trouble could be brewing.
At the moment gold is trending lower as shown on the chart (see link above for all charts). The GLD ETF could return to the summer 2012 lows prior to rallying.
What’s my conclusion about US Stocks for the week? Before the early November high was breached on Friday, I felt the weekly chart was supportive of a rally. Now the market can turn down as easily as up. Why? Because of the weekly close below that important November high. Despite that negative point, the weekly chart looks a lot like what happened in the summer. There was a lot of volatility up and down back then too, but the market went a lot higher before correcting. I’d give the edge to that scenario which is Bullish in the face of uncertainty! The Dow Transports seem to agree with me, finally taking out the prior series of daily highs.
This SP500 WEEKLY chart is available here:
SP500 Index Weekly Chart at 12-21-2012 Close Thanks go to Worden Brothers® for the charting software. (See my resources page on the main site for details)
Hope everyone has a great holiday week. We’ll survive the cliff as we’ve survived the Mayan calendar. ; )
Standard Disclaimer: It’s your money and your decision as to how to invest it.
The above is the text from this week’s free report. To receive future reports ahead of publication of the text shown above AND much more market timing information, please subscribe for free here:
Free Subscription to My Weekly Newsletter
If you “liked” this post, would you please “Like” it at the “Share” arrow below? Thanks very much!
And to follow my Buys and Sells and up to the minute insights, please follow and bookmark my Twitter feed here: Join Me on Twitter
Copyright © 2012 By Wall Street Sun and Storm Report, LLC All rights reserved.
