A Market Timing Report based on the 2-22-2013 Close published Sunday February 24th, 2012
UPDATE 2-28-2013 @ 12:11 am updated @ 9:24 am: The further bounce in the SP500 Index has fallen short of the breakdown point at the base of the channel as shown in the chart below, so there is certainly no point in buying until that strength is shown. I would say that despite the emotional indecision in the market, the Bears still have the ball. The lower channel line must be exceeded to give control to the Bulls and would like result in a retopping at the recent daily high if it were to happen.
Sometimes it takes a few days for the market to digest comments from Chairman Bernanke and that is what has been playing out. It is the fight between those who believe the Fed will be done with its easing this year and others who think it’s still going to continue for an indefinite period of time. More Fed interference supports higher equity prices. Bernanke has admitted to this. The updated chart is below:
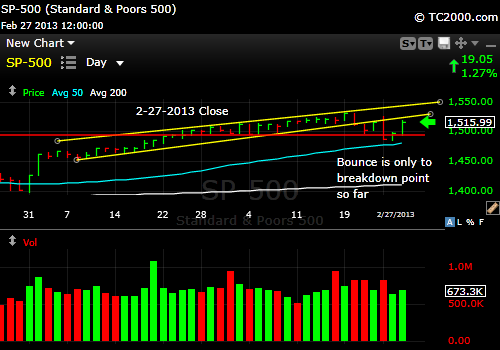
The SP500 Index has to get back above the lower line forming the channel to show real strength.
There are some markets like Biotech that are already rechallenging their recent highs, which does give the Bulls some hope. Still, I would not buy biotech until new highs are achieved or until a significant correction is sustained. This is NOT the place to buy.
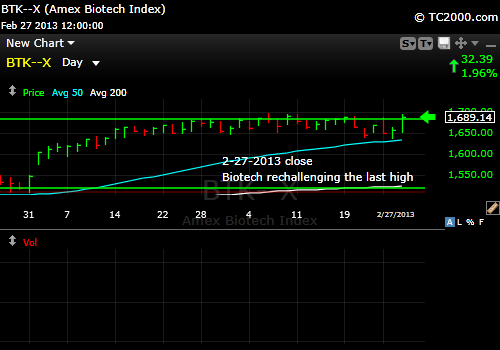
The Biotech market is one market where the Bulls are running ahead of the SP500 Index.
I thank Worden Brothers for the charting system. If you want to know more about the charting system I use every day, go to my “Other Resources” page here:
My Chart Source
UPDATE 2-26-2013 @ 9:24 am: The bounce in the S&P500 futures so far is not enough to erase the last technical signal. The first sign of strength would be a rise above the 2.21-2013 low of 1497.29 or better, a move above the 2-7-2013 low of 1498.49. If we get above 1511.95, we can retop or, less likely in my view until a further correction is sustained, even breakout again and reach my 1553 target or the 2007 highs. I lay out both scenarios to provide you with a guide to the technical terrain.
One cannot predict surprises by definition, but the reaction of the market to an event like the Italian elections gives us a hint that the market wanted to correct in the first place, because it is likely out of proportion to the real risk of holding a second Italian election. How the market behaves following various surprises tells us where the market is leaning.
The risk for the Bears is that Bernanke’s comments today will goose the market. He’s very good at it. That would be yet another surprise, because there is a growing feeling that the Fed may tighten by the end of the year, not a popular idea, but it’s gaining some traction. If Bernanke attempts to wash away the fear, the market will respond positively as most still feel he has control of the board of governors. As I’ve said, the bond market will take control away from him, not the board. That’s why we are watching yields so closely.
UPDATE 2-26-2013 @ 12:13 am ET: The US stock market (SP500) did take a dive today after it rose back up to where it started, so the pattern is following the sentiment pattern noted in this week’s text below. It was actually a classic key reversal day with a rise to a higher high than the previous day, a lower low, with a close near the low. That means more downside to at least the 50 day moving average currently at 1476.72. If that level does not hold 1400ish is possible. There are other trend lines that could stop the correction before we get there.
I’ll be watching this correction and reporting on Twitter. Today also brought us a fall of the 10 Year Treasury in yield (Treasury rally) and gold was up as well, all part of the rush to safety trade. The 10 Year Treasury (TNX, TLT) should have continued its rise if the economy were indeed recovering. I believe new highs in the SP500 Index above the 2007 high will be accompanied by somewhat (not too much!) higher interest rates of at least 2.4% or so on the 10 year Treasury.
There is another stress awaiting the economy besides slowing worldwide growth. Remember that we are also headed toward the sequestration of U.S. government funds with lots of cuts that cannot help the economy as necessary as they may be. That a government must operate in such an unconscious way to accomplish a modicum of fiscal responsibility or the illusion of such is amazing.
And now for this week’s text….(for more sign up for my report at the end).
Kissing the channel goodbye means that this week the SP500 broke its daily up trend channel to the downside. It then bounced up a bit to kiss a spot just below the lower channel line. That is not good enough. It is spot to short, not buy, with a stop of course.
Why did this happen? People were reading the Fed’s diary, well actually their minutes, this week. Maybe they should keep their diary to themselves! What it implied is that the Fed might take its collective foot off the gas and particularly that the number of inflation hawks was on the rise on the committee to the point that Dr. Ben Bernanke may have to give in to them. I think what he’ll give into is NOT the Fed Committee, but to the bond market. The bond market is going to run the Fed going forward after being run by the Fed over the past few years. They are going to lose control of interest rates finally. When? Based on the recovery that is only slowly appearing it could happen by the end of this year. If the slowing of the world’s economy gets any worse, it will take 2 or more years however.
What’s an investor to do? Follow interest rates. That is why I’ve included the 10 year Treasury Note chart as the Bonus Chart of the Week here at this link: Market Timing Charts for Sunday’s Issue (opens separate window so you can access all the charts)
What has this done to housing stocks (HGX, ITB)? Here’s the chart:

Housing stocks suffering under rising interest rates.
Note that if you are getting a “sheen” in the chart above, you can download the file first and then open it directly in Adobe Reader as opposed to opening it within a browser and that sheen may go away. Let me know if that was not the case for you.
And what was the bounce back in the S&P 500 Index about? Fed Governor Bullard from St. Louis indicated that the market had over interpreted their Fed diary reading. The market responded as it has for years to big bunches of dollars or the promise of the same; it went up!
The SP500 Index channel kiss can be seen at the link to the charts above.
The Bull-Bear spread in the American Association of Individual Investors Survey, which is simply the Bull minus Bear percentage, has fallen and the fall is more ominous than I thought it would be. The picture is similar to the 4-05-2012 picture, after which there was a slight further correction followed by a rally to the same place and a moderate sell-off that was simply a correction in the Bull market into the month of June. In sum, the pattern that could repeat itself is “down a little,” back to where we started and then a correction, not a Bear market quite yet. Since “where we started” was the Wednesday close, we may have already had the “back to where we started” leg, since the market has popped back to just that spot. So sentiment says a mild sell-off could continue on Monday. Should the market not check in with me and we were to go straight back up to the 2007 high right away, I’m guessing that it would provide important resistance.
What does the VIX volatility index say? The VIX peaked and came down quickly on Friday and that pattern suggests that we could have at least a few more days of decline in the VIX (5-10, 10 if there are sideways moves in the VIX on the way down.). That means the rally could resume for that long. That would move us up as high as 1553 for the SP500 Index before the next leg down occurred. The takeaway would be to consider at least rebalancing your stock allocation if the market rises that high if not taking a bit off the table and re-adding if necessary. NOTE: The VIX absolutely wiped out the pattern noted above by blasting back up today after the market turned sour on Europe following the Italian elections.
Foreign markets like China (FXI) and the Hang Seng Index (EWH) are selling off more than our markets. China has been talking about tightening up their money flow and it’s not being taken well. Weakness has entered the Indian market too (PIN). This is why the Emerging Markets (VWO) are a sell this week. I have given them more slack than they deserved this past week.
What is happening to “stuff” like commodities and gold in the meantime? It’s not a great picture. Gold is hanging onto what is simply a consolidation (sideways move) after a steep plunge recently as shown via the link above (click the link to open all the charts).
The last two market days are called “inside days,” and fit the pattern of consolidation, not that of a bounce. An inside day tells you that buyers and sellers are fairly balanced because the high and low for the day are within the prior’s day range. The next move will be dictated by the next move in the 10 Year Treasury. If you see the latter break the yield trend line to the downside, gold will rally. If you see the opposite with a yield breakout, gold will fall further to the 2012 lows.
Commodities are testing important support as well. They have been tracking gold fairly well since Aug. 12th, but over the long hall have greatly underperformed gold. It’s apparently easier to come up with more of the other stuff than it is the shiny stuff.
The gold and commodity weakness says that investors believe, correctly or not, that there is no inflation risk to the Fed program of bond and mortgage backed security buying. When that proves incorrect is when owning more gold will pay off. The stronger dollar (UUP, USDX) this week also hurt gold. Gold stocks (GDX, HUI) are in a cascading sell-off that will only be reversed when gold finds real support.
Our numbers are growing, so welcome to recent subscribers by the way. Please send me your comments and questions by replying to the emails or via the contact box. That goes for all of you!
Standard Disclaimer: It’s your money and your decision as to how to invest it.
The above is the text from this week’s free report. To receive future reports ahead of publication of the text shown above AND much more market timing information, please subscribe for free here:
Free Subscription to My Weekly Newsletter
If you “liked” this post, would you please “Like” it at the “Share” arrow below? Thanks very much!
And to follow my Buys and Sells and up to the minute insights, please follow and bookmark my Twitter feed here: Join Me on Twitter
Copyright © 2013 By Wall Street Sun and Storm Report, LLC All rights reserved.
