A Market Timing Report based on the 3-01-2013 Close published Sunday March 3rd, 2013
UPDATE 3-07-2013 @ 12:10 pm ET: The REITs did in fact break out and are now consolidating (moving sideways) just above the breakout point of 959.48 (see the prior chart below). If you pull up the chart on your favorite site, you’ll see how the market moved just below the breakout point and recovered. That means the Bulls are still in charge, but we’ll have to see if the breakout holds. If not, I’d use a stop on a newly acquired position. And watch interest rates as noted in the discussion of housing below. And now for today’s chart….
I specifically wanted to look at the correlation between the housing stock index (HGX, ITB is close to it but includes HD etc.) and the 10 Year Treasury Yield. You can see the correlation here with TNX (10 yr. Treasury) in yellow:
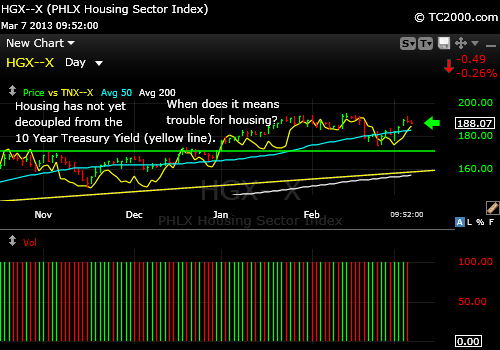
Housing stocks have been correlated with interest rates so far, but when will they decouple?
When the 10 Year Treasury Yield runs in the OPPOSITE direction to the housing stock index (HGX), you’ll know the housing market is going to have some trouble. Low rates keep the housing market attractive, because the overall cost of owning a home is highly dependent on the mortgage loan costs o the buyer. I think the decoupling of the correlation of housing stocks and the 10 Year Treasury Yield could happen with a new breakout in yield for the 10 Year Treasury Note (TNX). When that happens, be sure to have a stop on your housing stock gains. If it does not happen, the housing stock Bull run may continue for a bit.
What we are seeing is localized inflationary pressure built courtesy of the Fed for the housing market through the purchase of so much housing debt and from outright purchases of Treasuries. They are also goosing the stock market and admitting to it as I’ve been reporting all along. And eventually gold will have another run before this whole thing ends. I’ll be reporting on that again this weekend, so now would be a good time to sign up using the link at the bottom of this post. You’ll hear from me by Sunday evening and be one step ahead of the market. That’s my intention.
UPDATE 3-05-2013 @ 12:03 am ET: Some markets are still below resistance (unlike the biotech market as shown in the chart in this week’s issue below), such as the REITs. There is some fear of rising interest rates despite the rally of Treasuries that preceded the Bernanke testimony to Congress this past week. The following chart shows why we need to wait to buy a breakout in some markets:
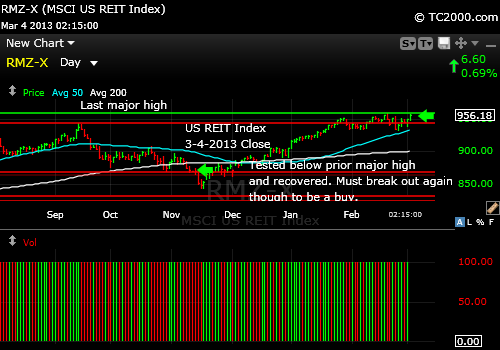
US REIT index is below resistance.
And now for this week’s text…
Let’s start with some good news. Biotech (BTK) has broken out once again. Those who noted that drug companies are having to buy biotech companies to keep their pipelines full are right. Biotech based drugs are more likely to have a closer relationship to the actual biochemical disturbance of the patient’s system or be able to more specifically target a patient’s cancer or virus, because the immune system does have great specificity when functioning normally. I’m a molecular immunologist by training and the co-discoverer of NF-AT (I found its source and my co-discoverer had some critical technical expertise that led us to the NF-AT molecule that forms all vertebrate heart valves and part of the nervous system and that regulates the immune system, particularly the interleukin-2 gene which drives the growth of T-cells in our bodies. T-cells are responsible for killing tumor cells, viruses and other foreign targets. The specificity of the immune system is the power behind the biotech industry. Here’s the biotech chart revealing the latest breakout:
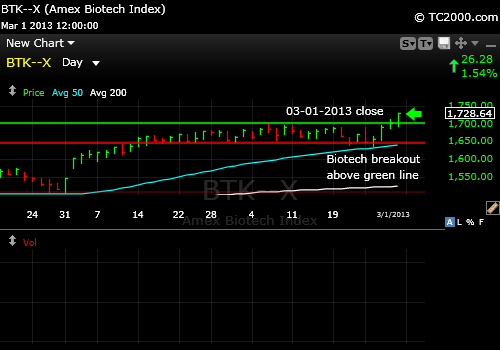
Some markets like biotech have strong fundamental reasons for breaking out.
Gold (GLD) continues to disappoint investors and gold stocks (GDX) have broken support ahead of gold this time. They need to recover quickly to avoid massive further damage and Monday would be a good choice. Gold reacted positively this week for a short while, as the chart shows (please click the link below so you can view all of this week’s charts and refresh the pages to be sure you have the latest chart.)
Market Timing Charts for Sunday’s Issue (opens separate window)
The US Dollar Index (USDX, UUP) will likely retest the July 2012 high next, so gold has a headwind in the way. Dollar strength and a lower level of Euro Fear has been hitting gold with a one-two punch. The thing that is holding gold up a bit is continuing negative real interest rates. If that changes, I’ll dramatically lower my long term GLD position. I have no open trading position in gold and a miniscule position in GDX.
In the meantime, the SP500 Index (SPX, SPY) is struggling below the breakdown point mentioned last week. Remember the “kissing of the channel.” Well, there was a second kiss on Friday. So that is twice the market has failed to show true strength. View the chart at the link above.
The Treasury market decided to celebrate Chairman Bernanke’s testimony a day ahead of time as the chart shows at the above link. This leaves the Federal Reserve in charge for now. You will know when things have truly changed when we top 2.4% yield in the 10 Year Treasury (TNX, TLT). Until then, Dr. B has the interest rate ball. Investors have been taking profits out of stocks and moving back to safety to some degree. That is particularly evident in the VIX explosion this past week. Despite the pullback toward the end of the week, the VIX is still above the early February high. This also means that there is room for the VIX to fall of course.
Sentiment is the real trouble spot. This week the AAII survey of individual investors showed the Bulls falling from 41.79% to 28.39% and the Bears rising from 32.50% to 36.59%, which leaves room for further bearishness to develop. The spread moved from 9.3% to -8.3%. More importantly, the pattern is almost a duplicate of that of the April top in the market last year, which led to the moderate correction that ended in early June 2012. But first things first. The correction was delayed a bit during the prior similar episode, which is likely this time too. Sentiment may now move back toward neutral with a bump UP in the SP500 Index to the prior high or to a somewhat higher high followed by a moderate correction. That is within the realm of possibility.
In Fibonacci wave terms the pattern (see SP500 Chart) is one wave down, two waves up (the two small bumps up on the daily chart), and the next down wave, which is the “3 wave,” would start Monday. What all this says is that the SP500 is behaving as if its days are numbered or over for a while before it once again resumes its up trend based on further economic recovery around the world.
Remember that we follow the charts around here, while keeping an eye on the fundamental story, so if we get a new high in the SP500 Index, the recent weakness will be essentially canceled and a further more substantial rally will follow. That is not what I favor due to the backdrop of Europe in recession and the US economy slowing from the sequestration of funds by our federal government, which will lower GDP by 0.5-1% according to various estimates. I believe this market will be in a better buying position in days to weeks, and we should hold some cash to take advantage of that opportunity.
Note that among the foreign markets we follow, the emerging markets and Europe are rated sell for now, despite their potential to bounce a bit with a US rally. My actual sell points are reported on Twitter and will be reported in these issues as well. I use stops that exceed the signal points a bit, to avoid being jerked out of markets at key chart points. The Pacific Rim is again a BUY as noted in this week’s table (see link below to view the Market Timing Table).
Have a great week investing and/or trading!
Standard Disclaimer: It’s your money and your decision as to how to invest it.
The above is the text from this week’s free report. To receive future reports ahead of publication of the text shown above AND much more market timing information, please subscribe for free here:
Free Subscription to My Weekly Newsletter
I thank Worden Brothers for the charting system. If you want to know more about the charting system I use every day, go to my “Other Resources” page here:
My Chart Source
If you “liked” this post, would you please “Like” it at the “Share” arrow below? Thanks very much!
And to follow my Buys and Sells and up to the minute insights, please follow and bookmark my Twitter feed here: Join Me on Twitter
Copyright © 2013 By Wall Street Sun and Storm Report, LLC All rights reserved.
