A Market Timing Report based on the 3-15-2013 Close published Sunday March 17th, 2013
UPDATE for 3-20-2013 @ 10:14 am: The market is bouncing based on aid from Russia to Cyprus of 10 billion dollars. The chart below shows:
1. The price of the SP500 Index is still below the yellow line which was the prior up trend line that was broken last week. A close above the high for yesterday (1557.25) would be the first sign of strength.
2. The SP500 has overhead resistance at the last recent high (aqua horizontal line near the top) and ..
3. Then comes the 2007 high which could also act as a resistance point for traders (top green line). One more thing…if you appreciate this update would you please like the page at the bottom? Thanks.
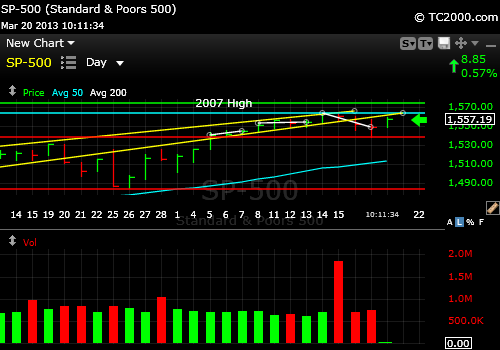
SP500 Index facing overhead resistance as it bounces on the news of aid from Russia to Cyprus.
UPDATE for 3-19-2013 @ 10:00 am: Volatility did indeed snap back and the market corrected a bit yesterday with the Cyprus announcement that they would seize up to 10% of bank deposits to strengthen their banking system. Not too subtle!
Steal from depositors to shore up the banks? That has been going on in the US since QE started, but in a less frontal way, by paying out almost zero on most bank deposits in a regressive way. Those with higher levels of deposits have been making a bit more in the US. If this were to spread, it would cause another Europanic, so we’ll have to keep an eye on the charts and not make assumptions based on interpretations of the facts by the press.
And now for this week’s report…
The SP500 Index continued to edge up this past week, moving up and entering its 3rd consolidation (sideways move) during the 9 day rally. The market is approaching the 2007 high, and it can easily get there and even exceed that level. The question is whether this will happen before or after a pause. Consumer buying was found to be a bit stronger than expected this week and the employment numbers continued to look better. This represents the opportunity for relatively safe growth compared to the rest of the world, where growth is very elastic.
At least as long interest rates remain below 2.0% or so, our stock markets should be OK. I think 2.4% would be tolerated by the SP500 Index, but not by the housing index (HGX, ITB). There are two SP500 charts this week, one of which shows the uptrend in a channel and the other the higher power view of the 3 steps up, one after another over the past 9 market days. The SP500Tracker™ Charts are here:
Market Timing Charts for Sunday’s Issue (opens separate window)
Luckily for the Bulls, sentiment still has yet to reach extremes. This week the AAII Survey of Investor Sentiment Bulls were at 45.42% and Bears were at 32.03% and the spread turned back to positive with the Bulls in charge at +13.4% vs. -7.5% last week. That spread is not that high and the Bulls can keep running from 40% to 50% up to the end of April when the Bears usually come out to play.
Chart back around 12-12-2013 when Sentiment was similar to today’s.

Investor sentiment was similar on 12-12-2012 as it is now.
I thank Worden Brothers for the charting system. If you want to know more about the charting system I use every day, go to my “Other Resources” page here:
My Chart Source
What will keep the market moving up is a continued sense of “Oh, I don’t know if this thing has much left.” That is called the wall of worry; however, despite a Euro slowdown, things are “less bad.” Relative US stock market value vs. the 2007 high is better now than it was then and far better of course than in 2000, when PE’s were far too high. I have to admit that the last time sentiment was close to the current combination was Dec. 12th following which the market went down for 2 days, up 2, then down 7, followed by a rapid rally back up as shown in the ABOVE CHART (we’ll get to the one below next). The net effect was a minor correction in an up trend and that is what I expect now. The correction will scare a bunch of late investors out and then the rally will resume.
That however is the more optimistic scenario. The other is this:
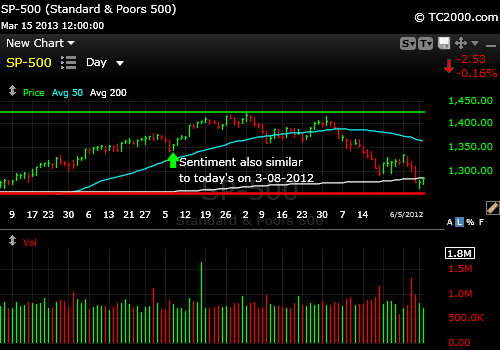
Another investor sentiment match that was less rosy, except for the very short term.
In the above March 2012 scenario, first note that the time of year is identical. We are headed back to the “go away in May period.” That would give us about 9 more good market days with continued positive sentiment in the teens followed by marginal new highs up to about April 1st followed by a decline. Note the lower high in the above chart which occurred on May 1st, the perfect “go away in May time.” I expect the market to have some trouble that will start in 10 market days or fewer based on current sentiment. If a correction starts right away (within the next market week), we could then TOP the 2007 highs before ending the rally and seeing a more substantial 7-10% correction. So an immediate correction will allow more for the Bulls than one that is delayed another 9-10 market days.
The VIX is holding new lows, BUT is stretched now to the downside (low level of fear). The last 2 snapbacks came at an identical place, and that would favor the immediate correction starting Monday or Tuesday. The Bulls still have room to run sentiment back down to the 2007 lows though, so don’t think the Bears have an edge here yet. The edge may only be a mild correction as I discussed when reviewing the sentiment numbers.
Dr. Bernanke, at helm of the Federal Reserve, seems to still have control of the ball on the interest rate court. There was a dive from a potential breakout in yields back below 2.0% for the 10 Year Treasury Note (TNX, TLT, TBT) as shown in the Bonus Chart of the Week at the above link.
The interest rate news is good for housing, but rates are a bit higher now and housing stocks have underperformed the S&P 500 Index as I felt they would at the beginning of the year. Note the lag below the yellow SP 500 Index line since housing stocks (HGX, ITB) peaked on the far left:

Plotting housing stocks vs. the SP500 Index since the last top in the housing stock index.
See the way the housing stock prices are lagging below the SP500 Index?
Having interest rates below 2% is excellent for gold, which has finally formed a clear higher low in early March, followed by the most recent consolidation just above there as shown in this week’s chart at the link above.
Gold is a buy here with a stop below the early March low for new positions. See the market timing table for more.
Have a great week investing and/or trading!
Standard Disclaimer: It’s your money and your decision as to how to invest it.
The above is the text from this week’s free report. To receive future reports ahead of publication of the text shown above AND much more market timing information, please subscribe for free here:
Free Subscription to My Weekly Newsletter
If you “liked” this post, would you please “Like” it at the “Share” arrow below? Thanks very much!
And to follow my Buys and Sells and up to the minute insights, please follow and bookmark my Twitter feed here: Join Me on Twitter
Copyright © 2013 By Wall Street Sun and Storm Report, LLC All rights reserved.
