A Market Timing Report based on the 3-08-2013 Close published Sunday March 10th, 2013
UPDATE 3-11-2013 @ 7:12 pm ET: Intel provided a great trading example today. Some say to forget all intraday moves. Sometimes that works, but not always. Trading out of Japanese stocks on the first market day after the tsunami worked. I sold Intel based on the weakness earlier in the day. We will see how that works out. The chart below shows how Intel dropped well below the prior uptrend (white line) on Friday and today fell through the 5 day moving average (yellow line). The price then recovered by the close today to just 0.01 above the 5 day moving average. In the chart below:
ARROW 1 : The close for Monday, 3-11-2013. The green bar is mostly below the yellow line, which is the 5 day moving average.
ARROW 2 : The white uptrend line that was broken on Friday.
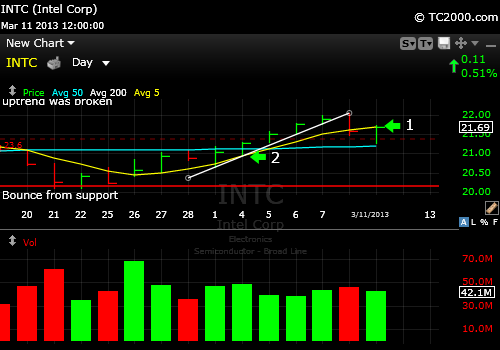
Intel recovers today after a swoon, but needs to show more strength.
I thank Worden Brothers for the charting system. If you want to know more about the charting system I use every day, go to my “Other Resources” page here:
My Chart Source
The problem for Intel is that the last two days still looks simply like a consolidation (sideways move). Yes, it did recover to a point just above the 5 day moving average, and it could continue a rally, but must show immediate strength. Otherwise the prevailing direction will assert itself. A move below Friday’s low would likely cause significantly more damage.
And now for the text from this week’s newsletter…
The SP500 Index (SPX, SPY) broke out again after a very minor correction. This means the Bulls are in charge still. The Dow (DJI, DIA) made new all time highs as you heard. According to some indicators, the SP500 is stretched. But looking at stretch via Bollinger Bands, there is room for a further rally, which puts the 2007 high into play. It’s just 1.6% higher than Friday’s close. In terms of PE ratios at the highs, the data shows we are at a lower PE ratio now than we were back in 2007. The length of this leg on the chart is almost identical to the leg that extended from June to September 2012 the Bears could complain. But why not go “all the way” to the 2007 high? The growing consensus is that the Fed will finally have to pull their foot off the monetary accelerator a bit, which will drive down bond prices and drive investors fearful of equities back to stocks.
The tipping point will be the resumption of inflation as the economy improves. If the Federal Reserve is very slow to pull back on the monetary stimulus, you’ll see the Nabisco boxes shrink to 10 cracker or cookie boxes for 3 bucks. “Honey they shrunk the cookie and cracker boxes” again, according to my brief survey this weekend. Still, commodity prices are low even though as noted below, there was a reversal upward this week.
So what’s the current sentiment scenario?
Sentiment is the key to what is going on I believe. Barring a left field disaster, which cannot be accounted for in the charts, this market is not ready to begin selling off yet. This week sentiment was at a Bull minus Bear spread of -7.5% barely changed from -8.2% last week. Now that we have a new high the situation changes from last week. Now sentiment can get a bit less bad and a bit less bad over a period of weeks. This could bring us to a brand new all time high for the SP500 Index. When the market peaked back in 2007, the Bull-Bear spread (difference) was +29% right at the peak, not -7.5%. There are too many Bears and too few Bulls at the moment for a market peak to occur at this point right after a breakout. The SP500 Chart which you can access at the following link shows where we are:
Market Timing Charts for Sunday’s Issue (opens separate window)
Yields are doing exactly what we expect if the stock market is to sustain a new high above the 2007 high. It supports what stock market gurus like to call the “Great Migration” into stocks, where they hope that the late 90’s as a period of rising enthusiasm for equities will happen all over again resulting in inflated PE ratios. The truth is that even with a modest increase in stock prices, the US market would not be that overvalued. This again favors the Bulls. The 10 Year Treasury Note (TNX, TLT, TBT [inverse ETF]) just barely broke out to a new recent high in yield (means the note is selling off, so the yield rises) on Friday as the chart shows at the link above (Bonus Chart of the Week).
The last high was on 2-14-2013 at 2.054% and Friday’s close was 2.056%, so we need follow through next week to confirm the breakout.
We need sustained breakout on the above daily chart to keep the stock market in rally mode. And it would be best if the10 year Treasury yield peaked at about 2.4% at most. Municipal bonds are falling. Corporate bonds are falling (LQD) steadily as well as this chart shows:
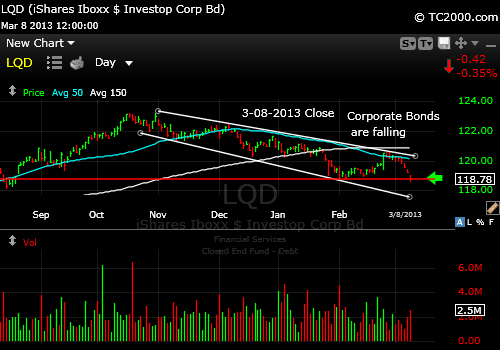
Steady downtrend in bond prices, since mid October.
As interest rates rise, the threat to gold (GLD) rises (read prior entries on the blog if you need to catch up about real interest rates and gold prices). The gold chart can be viewed via the link above.
Gold will likely hold up without another huge correction simply because Central Banks around the world are not going to allow it. First, they’ll continue buying gold. Second, they will continue printing money to continue digging us out of the housing mortgage crisis. We are up, but not out of the woods yet. If there is anyone we should respect in calling the housing market it is the man who called the last two major bubbles, the great Robert Shiller from Yale. His feeling is that housing has stabilized, but the crisis is not yet over.
The next drop in the housing market will likely come when interest rates cannot be held down any longer (below 2.4% particularly), finally driving up the cost of housing and making rentals less attractive for purchase. Much of the buying has been driven by real estate investors who are cash buyers. Many have done well, but it will be harder with rising rates.
So hold onto your long term gold positions. I would say that if gold were to break down again under current support, it would be time to lighten up on long term positions while being willing to re-enter when strength resumed. That is all hypothetical at this point. Commodities are in Bull 1 mode having completed a reversal to the upside last week. I don’t believe in buying and holding anything unless it is a business you know inside and out that can be properly valued. Others may differ and that is fine. If you want to treat your gold as a safety reserve, do so.
The last thing to watch closely this week is the VIX volatility index. It is back down testing the 2013 lows and could break out again to lower lows energizing the SP500 rally further. Doing so would confirm a further Bull run in the markets and likely more than a simple re-topping at the 2007 high.
Have a great week investing and/or trading!
Standard Disclaimer: It’s your money and your decision as to how to invest it.
The above is the text from this week’s free report. To receive future reports ahead of publication of the text shown above AND much more market timing information, please subscribe for free here:
Free Subscription to My Weekly Newsletter
If you “liked” this post, would you please “Like” it at the “Share” arrow below? Thanks very much!
And to follow my Buys and Sells and up to the minute insights, please follow and bookmark my Twitter feed here: Join Me on Twitter
Copyright © 2013 By Wall Street Sun and Storm Report, LLC All rights reserved.

This post is amazing. I realy love it
Thanks. I appreciate the feedback. Many hours go into each issue. If you sign up for the free newsletter, please feel free to send me suggestions. Enjoy your day. David