A Market Timing Report based on the 11-01-2013 Close published Sunday November 1st, 2013
GLD (now @ 126.95) made it through all three resistance lines last week and then reversed back BELOW all three. The breakout was a fake-out or false breakout. The close on Monday was at 130.56, which was a bit too cute, being just 0.05 points above the breakout. Here’s the chart:
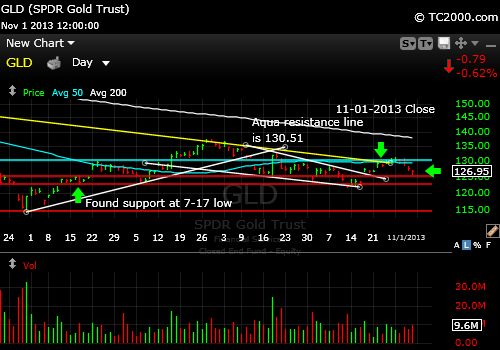
Gold fails at resistance after the Fed meeting.
I expect GLD to test 125.15 and then if that does not hold, the recent low on the daily chart.
The gold weakness followed the Fed statement. The market believes that the economy is recovering, so that less in the way of QE will be required going forward. That means higher interest rates with the Fed stepping out of the picture.
The thing that could help boost gold (GLD) and silver (SLV)is the impression that the Fed WILL NOT be able to step out of the way without having interest rates go to prohibitive levels that would shut down the economy. The other is rising inflation which is not in the picture at the moment. Inflation won’t be a problem until the economy starts growing too quickly with rates still very low.
Gold will do the best if it stays above the next support level, which would define a higher low. Otherwise the momentum it had will have been lost.
To keep up with my latest thoughts on my access page, you’ll need the password, which you can get here:
Free Subscription to My Newsletter
Standard Disclaimer: It’s your money and your decision as to how to invest it.
I thank Worden Brothers for the chart system I use to post these charts. If you want to know more about the charting system I use every day, go to my “Other Resources” page here: Other Resources It makes it much easier to follow along with me if you can see the charts and manipulate them on your own computer, so it’s a great investment to have an excellent charting system.
Look for updates on the main chart tracking pages this week as I feel they are needed and comments via Twitter.
Copyright © 2013 By Wall Street Sun and Storm Report, LLC All rights reserved.
