A Market Timing Report based on the 11-01-2013 Close published Sunday November 3rd, 2013
The SP500 Index held above the prior breakout at 1759.33 on Friday despite slipping a bit after the Federal Reserve meeting. That level must continue to hold or we’ll likely ease back to the top yellow line in the chart for starters. The September high would be the next target if that level fails. Although there is a risk of a pullback, I’d rather exit while preserving profits than exit early.
My immediate upside target remains that upper white trend line on the chart that represents the top of the monthly upward channel line.
We are in a similar place to 7-25-2013, but must move back above the Weds. close of 1763.31 to kick back into Bull gear. Back in July, that sort of action led to one more push up before a significant correction began.
I cover further thoughts on my access page from time to time, which you can subscribe to here: Free Subscription to My Newsletter (I’ll send you back the password)
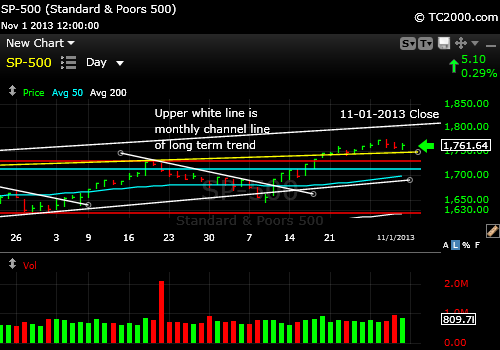
SP500 Index slipped a bit post-Fed meeting, but is still above the last breakout.
Standard Disclaimer: It’s your money and your decision as to how to invest it.
I also comment regularly on Twitter: Follow Me on Twitter
I thank Worden Brothers for the chart system I use to post these charts. If you want to know more about the charting system I use every day, go to my “Other Resources” page here: Other Resources It makes it much easier to follow along with me if you can see the charts and manipulate them on your own computer, so it’s a great investment to have an excellent charting system.
Look for updates on the main chart tracking pages this week as I feel they are needed and comments via Twitter.
Copyright © 2013 By Wall Street Sun and Storm Report, LLC All rights reserved.
