A Market Timing Report based on the 3-21-2014 Close published Saturday March 22, 2014
The SP500 Index (SPX, SPY) was below the prior breakout point two Fridays back and this week it closed below the all time high after failing to break out. The attempted breakout brought us to 1883.97, while the prior high was 1883.57. I don’t make up these numbers. When the market tests a high as it did on Friday, it often will test above the high. Buyers are still enthusiastic but a completed breakout takes buyers who are willing to “pay up” for the merchandise. If not enough buyers come in at these highs, the market can simply fall under its own weight. On a pullback there are few buyers and many more nervous sellers or shorts jumping on the decline.
The failed breakout defines the top very clearly, and the Bulls need to take out that high quickly to avoid a correction of magnitude. Why is it useful to know this? Because buying just below an obvious resistance point is not smart. You need to know where resistance and support lines are so you don’t sell at support and buy at resistance. You want to do the opposite, and it’s especially lucrative in a Bull market. In a Bear market, you have to be nimble and get out after each counter rally or simply stand clear during the bounces. After a sustained breakout, it can be OK to pile onto the next move, but you must be willing to exit on a reversal or that late entry can be very costly.
Here’s the SP500 Index Chart (click to enlarge):

SP500 Index: Bulls Must Take Out the High
I want to show you another chart this week comparing the market’s performance to the yield on the 10 Year Treasury (used to determine various interest rates; TNX, TLT, TBT).
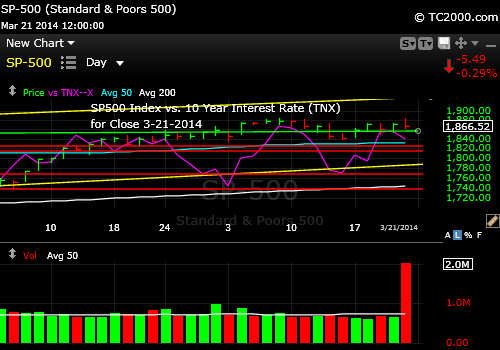
SP500 Index Plotted with 10 Year Treasury Yield in magenta.
You see that the SP500 Index has been moving up when interest rates have been moving up. That is because when the market feels that a stronger economy implies higher rates. The Fed will back off of QE and then, according to Chair Yellen last week, it will ratchet up the Fed Funds rate in about a year, because they feel the economy is recovering, and they don’t want to cause too much inflation. They have already increased the inflation rate, but feel it can and should go to their 2% target. Until that happens, we could see a reversal of or at least a pause in the QE tapering process that is underway.
You see that when rates have fallen, the stock market has pulled back as well, or has at least struggled to make any progress. On Friday, after a rapid rise from support in the few days preceding the Fed statement on Weds. and again on Weds. and Thursday, rates seemed to stop right at resistance, but then rates pulled back Friday, and the US stock market fell in a positive correlation. Falling rates also help gold and silver, which is why I added back some of my gold position on Friday afternoon (as Tweeted; more will be posted on gold tomorrow).
I’ll be writing up my investor sentiment analysis by Sunday night. You can access the work after getting the password here: Free Subscription to My Newsletter and access to my latest comments I’ll send you back the password to the access page and the monthly newsletter in the same email.
NOTE: The Gold and 10 Year Treasury Market Charts will be posted by Sunday evening.
Standard Disclaimer: It’s your money and your decision as to how to invest it.
I also comment regularly on Twitter: Follow Me on Twitter
I thank Worden Brothers for the chart system I use to post these charts. If you want to know more about the charting system I use every day, go to my “Other Resources” page here: Other Resources It makes it much easier to follow along with me if you can see the charts and manipulate them on your own computer, so it’s a great investment to have an excellent charting system.
Look for updates this week as needed via Twitter.
Copyright © 2014 By Wall Street Sun and Storm Report, LLC All rights reserved.
