A Market Timing Report based on the 4-25-2014 Close, published Sunday April 27, 2014
The SP500 Index (SPX, SPY) looks like an amusement ride lately, but the most recent market action did not amuse the Bulls. We formed and tested the right shoulder in the SPX, which has been under-performing a number of other key markets as shown on my home page this week in the comparison chart (see SunAndStorm.com).
Here’s the SP500 Index Chart (click to enlarge):
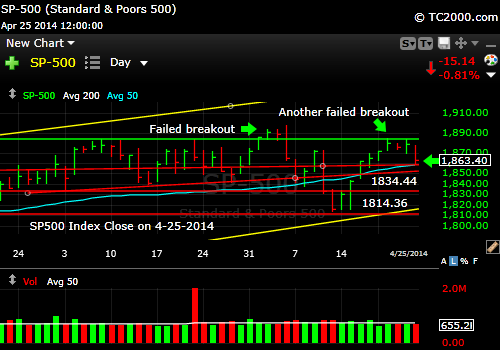
SP500 Index forms a right shoulder.
We tested the rising aqua line in the above chart, which is the 50 day moving average. Some like to make fun of commonly followed moving averages, but I don’t, because I realize that they are often the focus of market action. Could the SPX simply keep bouncing from the 50 day moving average support? Sure it could. But we can just as easily test any of the levels of support beneath the Friday close (red lines) or we could test the yellow line just above the bottom red line, which represents the base of the multi-week up channel.
To keep it simple, the market is churning its gains even if it moves all the way down to the bottom red line in the chart above. For a trader, that’s a long way down, but for an investor, it has less meaning. So take your pick.
Below that bottom red line, traders and investors will be experiencing new weakness requiring action for all but long term buy and hold investors in my opinion.
The sentiment spread between Bulls and Bears was again Bearish this past week, and you can catch up on current AAII investor sentiment on the “WSSSR Access” page and what it means for this pullback, after you subscribe: Free Subscription to My Newsletter and access to my latest comments/strategy I’ll send you back the password to the access page and the weekly newsletter in the same email.
Standard Disclaimer: It’s your money and your decision as to how to invest it.
I also comment regularly on Twitter: Follow Me on Twitter
I thank Worden Brothers for the chart system I use to post these charts. If you want to know more about the charting system I use every day, go to my “Other Resources” page here: Other Resources It makes it much easier to follow along with me if you can see the charts and manipulate them on your own computer, so it’s a great investment to have an excellent charting system.
Look for updates this week as needed via Twitter.
Copyright © 2014 By Wall Street Sun and Storm Report, LLC All rights reserved.
