A Market Timing Report based on the 5-02-2014 Close, published Sunday May 4, 2014
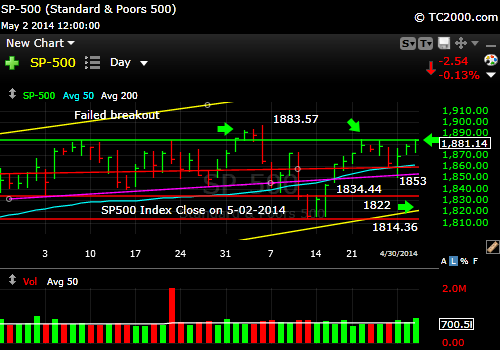
The SP500 Index (SPX, SPY) continues to be an amusement ride and it’s in dire need of an orthopod for that shoulder problem. When the market trades around a key resistance level as it did Friday and closes below it, you have to pay attention. One benefit of technical analysis is to get into a market at better times. Now is clearly not the time to buy the SP500 Index as we just failed at a resistance level. We can also escape the big downdrafts. Several support levels are shown in the chart:
Here’s the SP500 Index Chart (click to enlarge):
Right Shoulder Issue
A close above the green line would obviously allow for a re-topping of the SP500 Index and even a rise to the upper yellow long term channel line (numbers given in this month’s free issue – see link below).
The sentiment spread between Bulls and Bears was again Bearish for the second week in a row, and you can catch up on current AAII investor sentiment in this month’s issue of WSSSR™ and what it means in terms of a potential pullback, after you subscribe: Free Subscription to My Newsletter and access to my latest comments/strategy I’ll send you back the password to the access page and the weekly newsletter in the same email.
The best sentiment analogy this week is with a very negative period in 2011. You’ll want to read the text in this month’s issue (use the link above).
Standard Disclaimer: It’s your money and your decision as to how to invest it.
I also comment regularly on Twitter: Follow Me on Twitter
I thank Worden Brothers for the chart system I use to post these charts. If you want to know more about the charting system I use every day, go to my “Other Resources” page here: Other Resources It makes it much easier to follow along with me if you can see the charts and manipulate them on your own computer, so it’s a great investment to have an excellent charting system.
Look for updates this week as needed via Twitter.
Copyright © 2014 By Wall Street Sun and Storm Report, LLC All rights reserved.
