
A Market Timing Report based on the 5-16-2014 Close, published Sunday May 18, 2014
The SP500 Index (SPX, SPY) finally found some support and having broken down below the right shoulder of the head and shoulders formation and is moving up from the first level of support just below the 50 day moving average to test the right shoulder again (green line in the chart below). The low reached in the decline this past week was 1862.36.
Here’s the SP500 Index Chart (click to enlarge):

SP500 Index Still Faces the Right Shoulder as Resistance.
If the SPX makes it over the green line, we could see a brand new all time high, even an extension of the rally to the yellow up trend line (that is cut off on the above chart, but is at about 1956.5ish right now). With slowing corporate earnings based on weak GDP growth in the first quarter, I expect whatever bounce is generated from here to be truncated. But at the moment, investors seem to feel the economy is thawing from a slow wintery first quarter and so it may rally despite the poor GDP results.
In addition, I cannot rule out a further rally in the SPX because the Russell 2000 (small caps; see comparison chart from last week) recovered from a breach of a major low formed by the lows from mid-April to last week’s low.
Note that as far as the SP500 Index (SPX, SPY) goes, and it has not fallen nearly as much as the small Caps RUT, IWM), it fell back to a similar level just below the 50 day moving average on the past two pullbacks. Furthermore, ONE of the sentiment scenarios I outlined this week fits the current pullback. This means the Bears cannot get too cocky here.
But I expect with the soft data recently, combined with the more negative scenario in the sentiment data (see my “WSSSR Access” page on SunAndStorm.com), we could have a bounce here followed by another down-wave as we saw in the beginning of April (one wave down, two up, three down). We officially have 79% of our “maximum” equity exposure, 1though we are holding less in the RELATIVELY overvalued U.S. markets. Large caps are the least overvalued, so you may be able to just ride these waves out in the SP500 Index. The Russell 2000 has corrected, but may not have found its final low.
In the meantime, gold (GLD) is stuck as well, stuck in a range from which it needs to break out (click to enlarge):
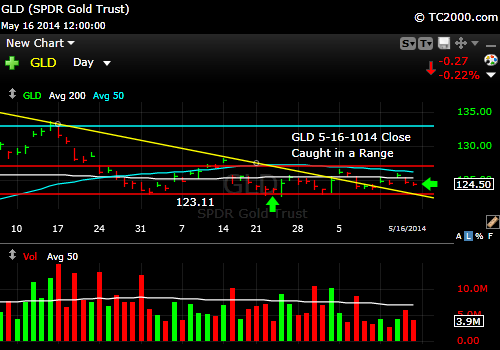
Gold is just plain stuck! But it’s not selling off either. Hold your gold for now with a stop.
The 10 Year Treasury Interest rate (TNX, tracked by TLT if Bullish; TBT if Bearish) are testing an even lower low, breaking down from the prior range, so let’s look at the 10 Year Treasury Yield below (click to enlarge):

Rates fell to a new recent low but are on support.
Gold “should” have rallied on the Treasury market strength and it’s a concern that it didn’t. It must hold the lowest support line on the chart above.
NOTE: One other important point about this Treasury rally is that it is being accompanied by dollar STRENGTH as opposed to dollar weakness. Sometimes as rates fall a currency is considered less attractive, but now rates are falling and investors are still buying dollars. That means there is a fear trade that is motivating dollar buying and perhaps some of that is due to the Ukraine.
You can catch up on our allocations to various markets here: Free Subscription to My Newsletter and access to my latest comments/strategy I’ll send you back the password to the access page and the weekly newsletter in the same email.
Standard Disclaimer: It’s your money and your decision as to how to invest it.
I also comment regularly on Twitter: Follow Me on Twitter
I thank Worden Brothers for the chart system I use to post these charts. If you want to know more about the charting system I use every day, go to my “Other Resources” page here: Other Resources It makes it much easier to follow along with me if you can see the charts and manipulate them on your own computer, so it’s a great investment to have an excellent charting system.
Look for updates this week as needed via Twitter.
Copyright © 2014 By Wall Street Sun and Storm Report, LLC All rights reserved.
