A Market Timing Report based on the 5-23-2014 Close, published Monday May 26, 2014
The SP500 Index (SPX, SPY) did rally, disappointing those who are Bearish. The problem is that the reasons stocks started pulling back (particularly the 0.1% GDP growth number from the first quarter) are still intact and money is going into bonds predominately and much less into stocks. So you have to be selective as I’ve been doing by holding both Microsoft (MSFT) and Apple (APPL) for example (from lower levels). Finding value is important in a lower growth environment, and growth stocks, particularly the small caps, remain vulnerable.
Here’s the SP500 Index Chart (click to enlarge):

SP500 Index above prior resistance and just below prior intraday high.
The market could be moving up out of the range it’s been stuck in since March. If the SP500 can move above 1902.17 convincingly, it could then head to the upper yellow trend line which is at about 1961 currently (see chart above). In the meantime, the small caps (Russell 2000 Index; RUT; IWM) indeed are continuing to bounce from support as pointed out last week as a positive sign. Market breadth usually goes hand-in-hand with a strong stock market rally, but the small cap bounce may be short lived due to the recent valuation concerns in the face of slower growth.
In the meantime, gold (GLD) continues in stuck mode (click to enlarge):

Gold is holding support, but rates are bouncing and the US Dollar is edging up.
NOTE (5-27-2014): 122.84 is the intraday low to watch today. A close below there brings more damage (loss of 2014 profits; so use a stop!)
The 10 Year Treasury Interest rate (TNX, tracked by TLT if Bullish; TBT if Bearish) has finally bounced from 2.471% yield support as shown on the chart (click to enlarge):
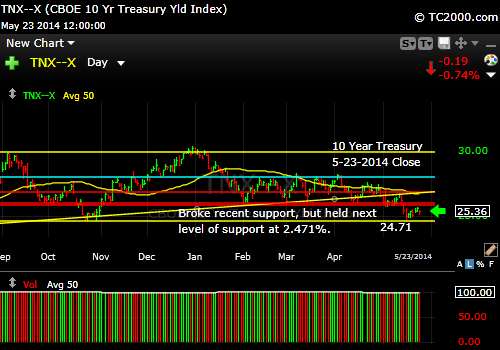
Rates hit bottom and are starting to rise again.
Rates are moving back up from the major support level reached on 5-15-2014. The US dollar is also edging up now and that could pressure gold, particularly if the Ukraine situation calms down. The European Central Bank is taking further action to weaken the Euro, the news says today, and that will bolster further dollar strength and could weaken gold unless inflation remains a concern, which it is at the moment. So you see the equation is very complex. So we go by the charts to get the market’s summary statement: Gold is still a hold.
We just sold an index based on the move up in interest rates. You can catch up on our allocations to various markets here: Free Subscription to My Newsletter and access to My Latest Comments/Strategy I’ll send you back the password to the access page and the weekly newsletter in the same email.
Standard Disclaimer: It’s your money and your decision as to how to invest it.
I also comment regularly on Twitter: Follow Me on Twitter
I thank Worden Brothers for the chart system I use to post these charts. If you want to know more about the charting system I use every day, go to my “Other Resources” page here: Other Resources It makes it much easier to follow along with me if you can see the charts and manipulate them on your own computer, so it’s a great investment to have an excellent charting system.
Look for updates this week as needed via Twitter.
Copyright © 2014 By Wall Street Sun and Storm Report, LLC All rights reserved.
