A Market Timing Report based on the 10-10-2014 Close, published Sunday October 12th, 2014
The SP500 Index fell to my 1905ish target on Friday. That COULD be it for this swoon. The script is that bounces occur even during the beginning of a Bear market. Is this a Bear? No one can tell you except after the fact, so don’t concern yourself with that speculation. Protect profits where you have them (unless we do in fact bounce Monday) and protect capital by removing some from the markets ONLY if you are willing to rebuy higher if you are dead wrong and end up selling at a low. I would buy this level only if I were willing to sell it below the next level of support shown on the chart below. Otherwise why bother?
If you believe the U.S. economy is on the mend still, then this is a buying opportunity and you should be adding more exposure as we head lower. If you followed my advice throughout this year, you have stayed out of small cap stocks and have stayed in large cap stocks until now. But now our allocation even to large cap U.S. stocks is now lower as I said on Twitter (see links just below here). We may add back exposure soon however.
To find out what I’m going, including buys and sells, please follow me here: Follow Me on Twitter®. Follow Me on StockTwits® You don’t have to make comments yourself to read my messages.
SP500 Index (SPX, SPY; click the chart to enlarge it):
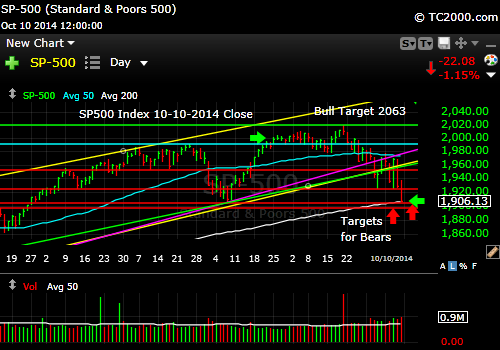
SP500 Index Hits Bottom
Meanwhile, this week investors became more Bullish into the Weds. night AAII survey close (moving up to a spread of percent Bulls minus Bears of 8.9% up from 4.5% last week), because the market went UP on the news that there was no Fed news. Yes, it was just about that stupid. What the non-thinking crowd did not get was that the Fed not doing anything special as QE ends this month is a negative. The Fed saying that it’s still waiting to raise interest rates is not enough when the economy is visibly slowing worldwide. Take a look at the IMF’s dim forecasts for Russia, Brazil and Italy for example: IMF Forecasts for the World’s Economies
The U.S. Small Cap Chart (RUT, IWM): The small caps broke down further and if you did nothing but listen to my warnings through this year on staying in larger stocks and out of small caps indices, you did much better.
Russell 2000 U.S. Small Caps (click the chart to enlarge it):

Small Caps break to new lows. Watch out below!
Gold: GLD, the gold ETF, held at the massive low we’ve been watching. Whew! Gold investors breathed a collective sigh of relief. That does not mean gold will keep holding if the world’s stock markets keep falling however, so we’ll be vigilant. The U.S. dollar came down a bit but needs to keep falling or gold will suffer further. There is room for gold to rally from here still.
The Gold ETF Chart (GLD; click to enlarge the chart):

Gold Survives at Major Support
The 10 Year Treasury interest rate (TNX, tracked by TLT if Bullish; TBT if Bearish) was back testing a major low on Friday. If rates don’t hold at that low, stocks will head lower still. So keep a keen eye on interest rates this week!
Please Click the Chart to enlarge it:
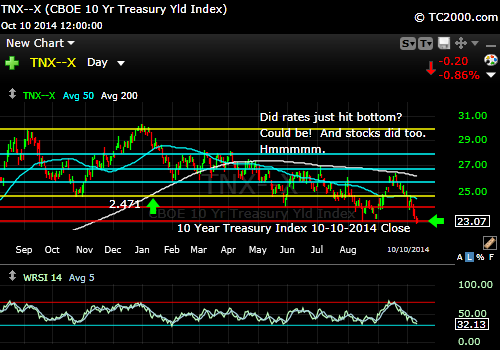
Rates are falling but on support.
Be sure to visit the website at: Sun and Storm Investing™
Standard Disclaimer: It’s your money and your decision as to how to invest it.
I thank Worden Brothers for the charting system I use to post these charts. If you want to know more about the charting system I use every day, go to my “Other Resources” page here: Other Resources It makes it much easier to follow along with me if you can see the charts and manipulate them on your own computer. It’s a great investment to have an excellent charting system. Check it out with a free trial at the link above.
Note that the newsletter is now closed to new subscriptions, but may be re-opened in the future. Stay tuned here in the meantime and follow all the action via the Twitter® and StockTwits® links above.
Copyright © 2014 By Wall Street Sun and Storm Report, LLC All rights reserved.
