A Market Timing Report based on the 10-17-2014 Close, published Sunday October 19th, 2014
The SP500 Index took another dive this past week, but seems to have found more significant support after the Fed and ECB came to the rescue. Dr. Draghi, the leader of the ECB, who has been draggy and NOT leading well, finally decided to buy the ABS that he promised to buy. The way he has rolled out this program is a stunning example of how NOT to lead. If you are going to do something, do it! Don’t simply yap about it. Bullard gave some added help to the markets by suggesting that the Fed might need to reverse the decision to end QE. The current QE is likely to end this month as planned, but QE4 could appear.
Before that extra help, the SPX slipped to the next lower level of support and bounced. As I pointed out real time on Twitter, the small caps led the way up. They provided the clue that a turn was imminent. You see, the indices don’t all bottom at the same time during a pullback. The Russell 2000 small caps held the level they hit on the 13th, while the large caps continued to test lower. My suspicion was that the SPX would recover rather than break to a still lower low, because the small caps had held the previous low. I’ve been right so far.
Realize that once a major low forms, it can be tested more than once, even if it holds. We are still at risk for that sort of move. So the people who are benefitting most are those who trade the volatility up and down. The same opportunity occurred in 2011, when I was able to trade Bershire Hathaway (BRKA/BRKB) stock up and down a few times. But it’s when you stick with a stock off a low that counts. Those decisions yield the big gains if you give them room. Not re-buying when a stock truly has re-bottomed is a big mistake. Luckily I was conscious around my Berkshire Hathaway trades and therefore own it from around the 68ish level since 2011.
I have a stop in mind if it breaks down too much. I will NOT ride that pony back to 68 from 137.09. You shouldn’t do that either. Set up all your stops now mentally (so the market makers don’t know them). And if you are wrong? Get back in if the story is still good for the company. Admit when you are wrong and move on. Sometimes moving on means buying the stock back.
To find out what I’m going, including buys and sells, please follow me here: Follow Me on Twitter®. Follow Me on StockTwits® You don’t have to make comments yourself to read my messages.
SP500 Index (SPX, SPY; click the chart to enlarge it):

A bottom in place for another rally or more volatility ahead?
Meanwhile, this week investors did not run for the exits into the Weds. night AAII survey close (moving up to a spread of percent Bulls minus Bears of 9.0% up from 8.9% last week), which I discovered can actually be Bullish as explained here: AAII Survey Says!
The U.S. Small Cap Chart (RUT, IWM): The small caps bounced from the low this week up to just below the 2-5-14 low of 1082.72. Initially, they led the large cap stocks up, but then lagged on Friday. If the RUT drops to a new low, the SPX will likely follow. A deep retest will occur in both in my opinion if one breaks down.
Russell 2000 U.S. Small Caps (click the chart to enlarge it):
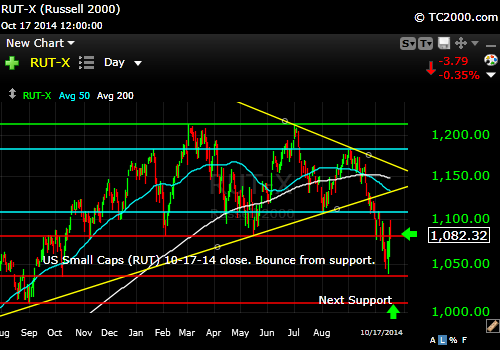
Small caps rebound. Just a bounce?
Gold continued to hold up as the stock markets fell apart last week. Yields tested very low levels as the second chart below shows and that should help support gold. Low rates will prevail due to a Fed that remains dovish against the backdrop of a weakening world economy. That pressures the US dollar and supports gold. Keep your gold for now.
The Gold ETF Chart (GLD; click to enlarge the chart):
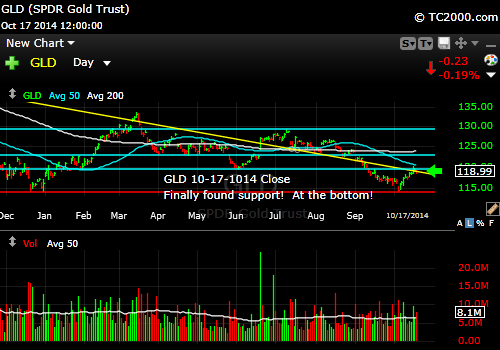
Gold bottomed and is holding up in the recent rally.
The 10 Year Treasury interest rate (TNX, tracked by TLT if Bullish; TBT if Bearish) was swooning profoundly in what looked like a capitulation move to me. Rates could continue to move down lower after the bump up after stocks recovered. Why? Because the Fed will have to keep rates low to support our economy as the entire world is showing signs of slowing. For that reason, I chose to start a TLT position on Friday. It goes up if yields fall further. I am contending by taking this position that both stocks and bonds can do well over the next several months.
Please Click the TNX Chart to enlarge it:

Rates should stay low and could move lower still as the Fed gets back to work
Be sure to visit the website at: Sun and Storm Investing™
Standard Disclaimer: It’s your money and your decision as to how to invest it.
I thank Worden Brothers for the charting system I use to post these charts. If you want to know more about the charting system I use every day, go to my “Other Resources” page here: Other Resources It makes it much easier to follow along with me if you can see the charts and manipulate them on your own computer. It’s a great investment to have an excellent charting system. Check it out with a free trial at the link above.
Note that the newsletter is now closed to new subscriptions, but may be re-opened in the future. Stay tuned here in the meantime and follow all the action via the Twitter® and StockTwits® links above.
Copyright © 2014 By Wall Street Sun and Storm Report, LLC All rights reserved.
