A Market Timing Report based on the 10-24-2014 Close, published Sunday October 26th, 2014
The SP500 Index bottomed and came up to form what is called a V bottom. Now there are many stories that will be told about how “We must retest the low!” and “That was it! We’re home free through next April!” and on and on. We conscious investors do not care what “they think.” We see what we see now and in the past and act on it as best we can. I can say there is a risk of a retest based on general market dynamics. Yes, that is one of those stories! The story goes that a certain level of healing is needed after a period of volatility. Retests are simply the market building its confidence in the general level of stocks we are at. When retests occur and hold the base, markets like that, and prices rise again. But this requires lower prices unfortunately!
There is still another Bearish story: The markets are rising on declining volume. See the chart below to appreciate this for the SP500. But do note that the volume is higher now than during the rise from the August low. Volatility is higher too, which could explain some or all of that however, so the decline in volume should be respected.
Is it advisable to have ANY cash at this point? That is a matter of your own risk management process. Our conservative portfolio has more and our aggressive portfolio less (85% vs. 95% invested in equities worldwide, respectively). I added back several individual stocks, which lower my risk over buying the entire market in my opinion, because I buy the companies that are still performing well and are likely to do so for months to come at a minimum. Can you really see farther ahead than that, other than having a certain confidence that a company’s management has a system and plan for making progress going forward?
Do NOT hold cash if you believe: 1. The worldwide economy has bottomed and will heal steadily now. Europe and China will not drag us down, because they are going to ease too. 2. All the risks are taken care of now, including ISIL, Ukraine, Eurobanking system, and Ebola. 3. The elections won’t shift the power balance in Washington and make it lopsided.
To find out what I’m going, including buys and sells, please follow me here: Follow Me on Twitter®. Follow Me on StockTwits® You don’t have to make comments yourself to read my messages.
SP500 Index (SPX, SPY; click the chart to enlarge it):
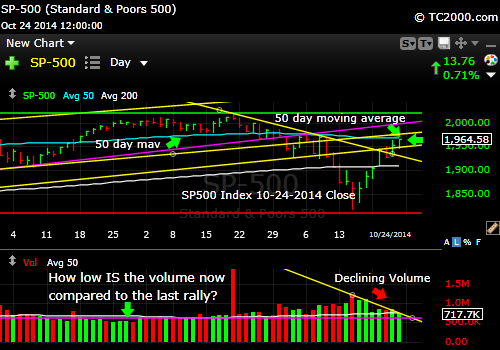
SP500 Index Rising from a V Bottom
The week before this past week I discovered that the rise in sentiment was actually Bullish as I wrote here: AAII Survey Says! This week the spread moved up from 9.0% to 27.2%, which is quite high. If this sentiment shift is like the last two similar ones in June and August, we are due for a higher high either now (as in June) or after a mild easing back of the market (as in Aug.) followed by a pullback that then wipes out all the gains and then some. The biggest Bull trap would be to rise quickly to 1985 or a bit higher and then wipe out ALL the gains from the prior low. I am not saying that is what will happen. I am saying that from the standpoint of sentiment, we should have SOME cash on hand to take advantage of lower prices. Should you hold some cash? That you’ll have to decide for yourself.
Remember that this is just ONE parameter and sentiment is sometimes dead wrong, especially with the Fed and ECB splashing more money onto the fire. The Fed meeting is this Weds. and if they indicate more dovishness, it could be a very merry Christmas for Wall Street. On the other hand, if they are as hawkish as they’ve been, watch out below.
The U.S. Small Caps (RUT, IWM): They are bouncing, yes, but toward what’s called a “Death Cross,” where the 50 day moving average slices down through the 200 day moving average. Small cap stocks sell off harder in a correction or Bear market because they are less liquid (not to mention, more overvalued still), and they come down faster as investors decide they should not buy any more of them and then the few sellers have smaller and smaller numbers of investors to sell to. That is how any market can drop even 7.5% in a day as happened even with the SP500 back in 2008. With the RUT, the losses were up to 9.47% in a single day.
When there are NO buyers, stocks can drop precipitously as was demonstrated during the Flash Crash back on 5-06-2010. That has supposedly been fixed, but it’s why putting a stop loss sell order into the market can result in major losses. I use stop limit orders, not sell stop orders, when I need to protect gains, even though some advisors will say you should not use them either. I disagree even though stop limit orders are not perfect either. Gaps down can prevent your shares from being sold if news suddenly hits the market.
What we don’t want to see is the small caps dropping right from the 50 day moving average. And we don’t want to see it for the large caps either and we are even closer to the 50 day mav for the SPX.
Russell 2000 U.S. Small Cap Chart (click the chart to enlarge it):
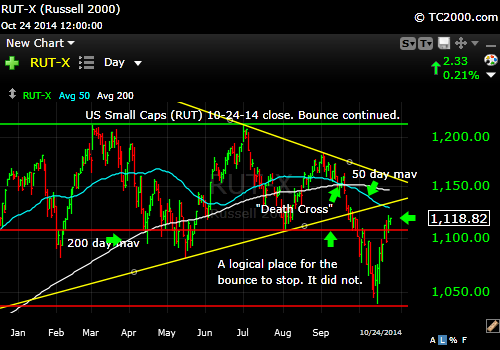
U.S. Small Caps Bounce Toward the “Death Cross”
Gold has eased back as rates backed up a bit (oddly enough from the 50 day moving average!), but the drop is not sustainable in my opinion. Why? Because the Fed is going to get on the case and delay raising rates even longer. There could even be QE4. That’s not clear yet. The economy is not in recession by any means, but growth has slowed and even more so in the European economy. Russia has just made it all that much worse. ISIL fears don’t help either. Ebola is another issue that certainly does not instill confidence. Since rates will stay low for a long time, gold will do fine. It should at least retain its value. If the market shows us otherwise, it will sink much farther below 1200 than it did during the last drop. For now, I believe you can buy the gold pullbacks.
The Gold ETF Chart (GLD; click to enlarge the chart):

Gold Eases as SP500 Rises
The 10 Year Treasury interest rate (TNX, tracked by TLT if Bullish; TBT if Bearish) has run up a bit, but I believe that should be about it. I think our entry point on Twitter/StockTwits was a day or two early, which is fine. We cannot expect to take positions at the exact bottoms or leave them at the exact tops. Want to know a secret? When a market dives to a certain level and then rebounds rapidly a retest is even more likely than if it takes a long time to recover. A slow recovery is much more healthy than what we’ve seen. That’s why the stock market gains are at risk and why U.S. Treasuries could be just what the doctor ordered for a hedge against stocks. The Fed will command the markets next Wednesday with their FOMC announcement.
Please Click the TNX Chart to enlarge it:

Rates Rise a Bit But Not for Long
Be sure to visit the website at: Sun and Storm Investing™
Standard Disclaimer: It’s your money and your decision as to how to invest it.
I thank Worden Brothers for the charting system I use to post these charts. If you want to know more about the charting system I use every day, go to my “Other Resources” page here: Other Resources It makes it much easier to follow along with me if you can see the charts and manipulate them on your own computer. It’s a great investment to have an excellent charting system. Check it out with a free trial at the link above.
Note that the newsletter is now closed to new subscriptions, but may be re-opened in the future. Stay tuned here in the meantime and follow all the action via the Twitter® and StockTwits® links above.
Copyright © 2014 By Wall Street Sun and Storm Report, LLC All rights reserved.
