A Market Timing Report based on the 11-14-2014 Close, published Sunday November 16, 2014
Updated on 11-23-2014: New charts are posted below each chart below for comparison. The SPX is at new highs and has room to move up further based on Bollinger bands, but is a bit stretched on the basis of RSI. Realize that rallies can occur even when RSI has peaked. When RSI falls as the market rises, it is much more telling. Note the upper yellow channel line on the chart below as well. The SPX could rise all the way to the top of the channel from here without pausing.
Small cap stocks issued another note of caution this week, failing to make new highs with the SPX. That shows that small cap stocks are out of balance with large cap stocks, and if they were to make a higher high now above the two lower highs shown in the chart below, that would signal more gains for the SPX as well.
Gold is back above critical support. At times, these sorts of tests fail, so we’ll have to wait for further upside confirmation. Attempting to predict whether inflation or deflation will occur over the next few years is a tough exercise. It is probably a better idea to follow the price of gold.
Rates have been moving sideways, and my guess is that they will retest the prior low in yield. The impact of Central Bank action won’t be immediate, which should keep rates low for a while. But the market needs to verify this impression. Yields now need to fall below 2.305% for a retest lower to occur.
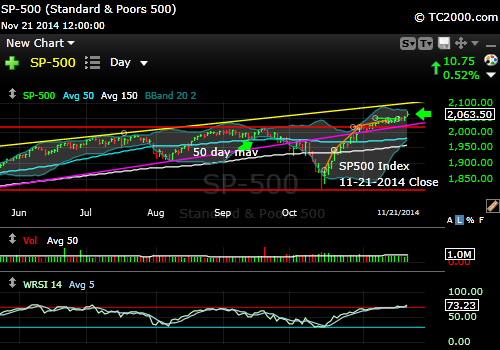
The SP500 Index rally to new highs has not been accompanied by an equal rally in the small cap stocks. This is called “bad breadth.” The market is being powered forward by just a few stocks like Apple (AAPL) compared to the entire universe of stocks that could be rallying together and have not continued to do so. In addition, what goes up very fast often needs to correct, and I believe that about to happen. It would be extremely unusual to get a V bottom after a sell-off of the magnitude we had in mid-October. Bulls argue that the market, even though richer than it was last year, is still the only game in town for investors. The risk has gone up on that bet however. Risk rises whenever markets get ahead of themselves and then seek to revert to the mean. Note the top being formed after two decelerations.
SP500 Index (SPX, SPY; click the chart to enlarge it):

A Stretched Market Just Made a New High
NEW CHART:
SP500 Index making new highs still.
This week was marked by about the same spread between Bulls minus Bears with Bears increasing while Bulls increased just slightly more than the Bears. There are still a lot of Bulls at the moment, despite those converts, so my prior take on sentiment still holds: AAII Survey Says!
To find out what I’m going, including buys and sells, please follow me here: Follow Me on Twitter®. Follow Me on StockTwits® You don’t have to make comments yourself to read my messages.
The U.S. Small Caps (RUT, IWM): Russell 2000 U.S. Small Cap Chart (click the chart to enlarge it): Just as last week, the small caps are lagging despite a bit more progress this week as the chart shows below. They have formed what is called a double two wave up, which can lead to an even bigger third wave down in Fibonacci terms. Alternatively, they could simply float down into the prior range without taking out the prior lows. Remember that the last low was in fact a lower low, so there is room to form a still lower low that would correspond to that 3rd wave down.
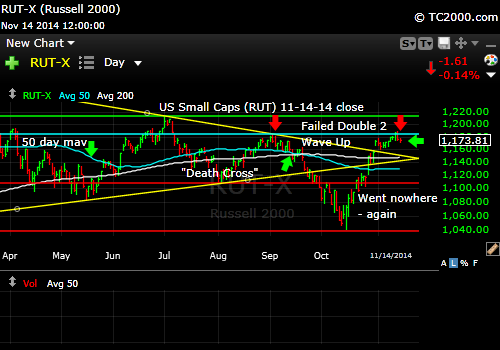
Small Caps Still Lagging, Not Reaching New Highs
NEW CHART:
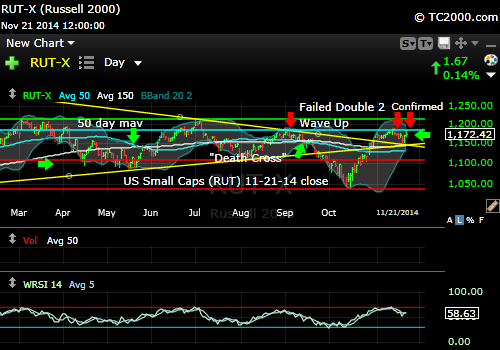
Small caps failed again.
Gold failed at support and started a bounce and then decided to backtest in a very harsh way, but it survived and bounced even more. GLD is now above the 10-03-2014 low of 114.42, closing at 144.47 on Friday. This may inspire the gold Bulls to buy even more this week. The dollar index failed a breakout last Friday and if it continues to correct, gold will fly UPWARD.
The Gold ETF Chart (GLD; click to enlarge the chart):
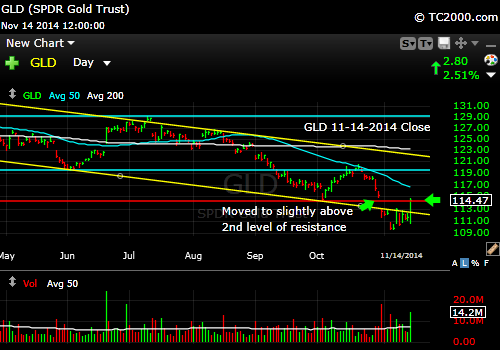
Gold finding a bottom?
NEW CHART:
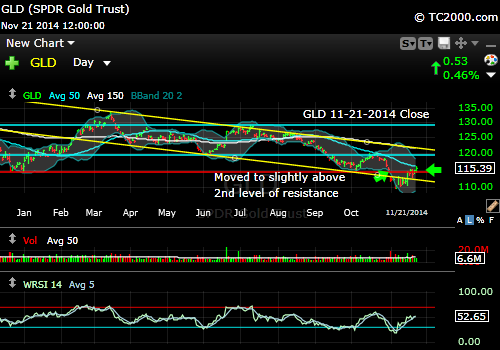
Gold is now back above previously broken support.
The 10 Year Treasury interest rate (TNX, tracked by TLT if Bullish; TBT if Bearish [note that it’s a 2X ETF while TLT is 1X]): The 10 Year Yield has been trading at what looks like a temporary high and is primed to retest that prior low shown in the chart. If it doesn’t, it must break above around 2.400%, which should not happen given the slowing around the world. Remember that falling oil prices are partially supply related but are also demand related due to the slowdown in the world’s economies. Both are deflationary pressures in economic terms.
Please Click the TNX Chart to enlarge it:
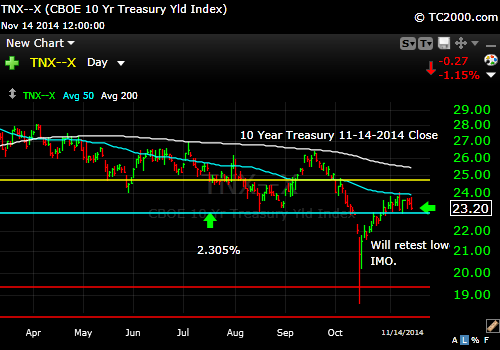
Time to Add to Bonds and Treasuries Again?
NEW CHART:
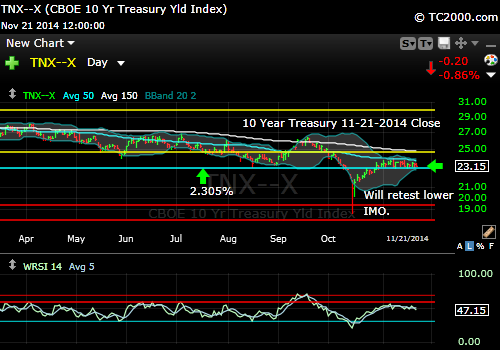
Are rates about to head down for a retest of the prior yield low?
In summary, I favor a corrective move lower in U.S. stocks that may have already begun for U.S. small caps. If small caps make news highs above current overhead resistance (see chart above), that scenario will be voided for now, and we’ll see big caps continue upward as well. You cannot have a game plan that only considers one possible direction. That’s called being a “perma-whatever,” and we are not that around here. Gold looks primed to rally further, and is supported by low to negative real interest rates around the world. The risk from the way we’ve seen gold trade of late is that it has fallen in the face of rising deflationary pressure. If those pressures persist, despite central bank action, gold prices could fall. Rates look ready to move lower now, which is why I loaded up more TLT last week, which rallies when Treasury yields fall.
Be sure to visit the website at: Sun and Storm Investing™
Standard Disclaimer: It’s your money and your decision as to how to invest it.
I thank Worden Brothers for the charting system I use to post these charts. If you want to know more about the charting system I use every day, go to my “Other Resources” page here: Other Resources It makes it much easier to follow along with me if you can see the charts and manipulate them on your own computer. It’s a great investment to have an excellent charting system. Check it out with a free trial at the link above.
Note that the newsletter is now closed to new subscriptions, but may be re-opened in the future. Stay tuned here in the meantime and follow all the action via the Twitter® and StockTwits® links above.
Copyright © 2014 By Wall Street Sun and Storm Report, LLC All rights reserved.
