A Market Timing Report based on the 3-13-2015 Close, published Sunday March 15th, 2015
UPDATE 3-17-2015: And the Winner Is? Small Cap Growth as shown:

Small Cap Growth Is Beating Small Cap Value and the SP500 Index.
And now back to this week’s issue: I keep my comments reasonably brief to honor both my time and yours. The rest is on Twitter®/StockTwits®.
The recent stock market selling, in my view, is due to rates going up in fear of the Fed raising interest rates into worldwide deflation (although maybe the rise ended last week). Perhaps Jim Cramer should pull out and replay his “They know nothing!” tirade about the Fed during the 2008 crisis. Of course, what the Fed SHOULD do and what the Fed WILL do are two different things.
My belief is that the Federal Reserve has introduced great distortions into the monetary system by making it easy for companies like IBM to borrow money at dirt cheap rates and then buy back their stock to raise their earnings per share without innovating and thereby strongly growing revenue. It is a Fed driven scam really (I’m sure there are many noble people at IBM who mean well), and it’s unproven that it will work or not work in the end as Stanley Druckenmiller has pointed out. He thinks the tricks won’t work at IBM as he had publicized his short repeatedly. But he also said on CNBC that he really did not know whether the Fed could get out of its balance sheet safely or not.
Those that tell you the Fed balance sheet will result in hyperinflation are likely as lacking in true insight as those who think the Fed can expand its balance sheet without limit. The only thing we know is that the longer they take to unwind it, the less flexibility they will have to do anything the next time action is actually needed. That is why the Fed is going to raise interest rates a bit even though there is worldwide deflation in the midst of now worldwide easing outside the U.S. and the U.K. Meanwhile, the Eurozone, Japan and China are all easing.
But there is downside to this tactic in U.S. corporate multinational earnings, because with every move UP in U.S. rates, up goes the U.S. dollar and down goes the competitiveness of U.S. multinationals in the short to intermediate term. I believe this is the most important reason stocks could struggle for a while.
Investors need to hold NON-struggling companies in the near term. That is why small caps are being favored in this pullback as they have less U.S. dollar exposure. They have bounced more than large caps as shown below (despite their higher valuations – if an individual small cap’s growth matches its valuation, it’s not an issue). Near term, profits for the SP500 Index are supposed to decline a bit in the first quarter. This is happening to an extent due to U.S. dollar strength. This will pressure U.S. multinational stock prices until other foreign currencies stabilize vs. the U.S. dollar. If the U.S. dollar keeps moving higher, expect the SP500 Index to move lower.
SP500 Index (SPX, SPY; click the chart to enlarge it):
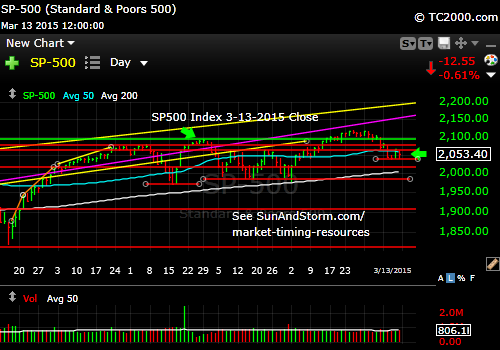
Pivot point. Up or down from here?
To find out what I’m doing, including buys and sells, please follow me here: Follow Me on Twitter®. Follow Me on StockTwits® You don’t have to make comments yourself to read my messages.
Small caps are stronger, as mentioned above. Stick with the high growers! Stock pickers will be looking for growth in a slowing economy this year. Small caps REGAINED their prior breakout, while the SP500 Index has not. Compare the chart below with the SP500 chart above.
Russell 2000 U.S. Small Cap Chart (RUT, IWM; click the chart to enlarge it):

Small caps are holding up better than large caps.
Gold has now basically destroyed its prior rally. Last GLD support is at 109.67 as mentioned last week. Watch interest rates and the U.S. dollar.
Gold should hold the prior low IF:
1. Rates stopped going up as of last week.
2. The U.S. dollar starts to ease.
Only in a financial panic can gold and the U.S. dollar rise together. We don’t have such a panic at the moment.
The Gold ETF Chart (GLD; click to enlarge the chart):

Gold nears last support.
The U.S. 10 Year Treasury Note:
Please Click the TNX Chart to enlarge it (see related ETFs, TLT, UBT and TBT; NOTE THIS IS A WEEKLY Chart): Rates hit the 200 day moving average and moved down this past week. A new high in rates may cause gold to fail its support. The stock market fear of the Fed is due to fear of U.S. dollar strength in the absence of strong economic growth.
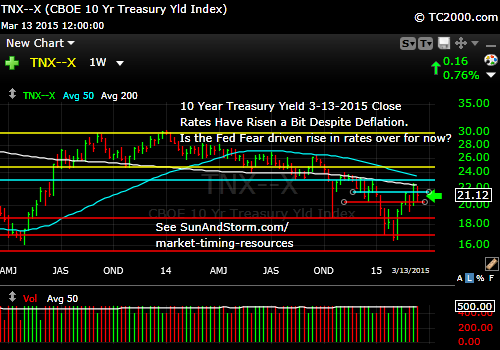
Have rates stopped rising?
CONCLUSIONS: U.S. stocks may be at a pivot point, where a bounce will occur. Small caps suggest a bounce, while large caps are lagging, still below the prior breakout. Follow interest rates, and you’ll know where stocks will go, because you’ll know where the U.S. dollar is going.
Gold must hold support or we’ll have another free fall.
Rates are driving the above almost single-handedly. Follow rates and you know what gold and stocks will do near term. When growth picks back up, this will change and we should expect gradually rising rates.
I cover foreign markets on social media (see links above) and in my monthly newsletter. Note that the newsletter is now closed again to new subscriptions: Join the Wait List to Join the Newsletter as a Loyal Subscriber, Opening again for the April. 4th issue. If you join and don’t read the newsletter, you will be deleted. I don’t publish to non-readers as other newsletters do. Stay tuned here in the meantime and follow all the action via the Twitter® and StockTwits® links above.
Be sure to visit the website at: Sun and Storm Investing™
Standard Disclaimer: It’s your money and your decision as to how to invest it.
I thank Worden Brothers for the charting system I use to post these charts. If you want to know more about the charting system I use every day, go to my “Other Resources” page here: Other Resources It makes it much easier to follow along with me if you can see the charts and manipulate them on your own computer. It’s a great investment to have an excellent charting system. Check it out with a free trial at the link above.
Copyright © 2015 By Wall Street Sun and Storm Report, LLC All rights reserved.
