
A Market Timing Report based on the 4-02-2015 Close, published Saturday April 4th, 2015
UPDATE 4-13-2015: There will be no publication this weekend. Celebrating “tax week” with the rest of you and re-accessing future offerings going forward.
MY CONCLUSIONS FROM LAST WEEK
Last week I said: “I’ll go out on a limb to say that:
– stocks (SPY, SPX) will rise a bit this week off the higher low formed at the end of this past week along with a
Right. The SP500 Index did rise a bit as shown in the chart below.
– stronger U.S. dollar
Right. The U.S. dollar was up slightly.
– weaker gold
Wrong. Gold was up fractionally.
– falling interest rates (rallying Treasuries and bonds).”
Right on TNX, the yield on the 10 Year Treasury, but wrong on TLT, which was down a bit. TLT tracks longer maturity Treasuries (17.05 years per Morningstar). I think we’ll have further gains in TLT by Monday.
Why should we see a rising TLT and falling rates? At 8:30 am on Friday we found out that only 126,000 jobs were created last month, far fewer than the 247,000 expected by Bloomberg. That suggests that the Fed won’t be able to raise rates as early as expected. It also suggests that stock prices may be too high. U.S. futures fell about 1% after the announcement. We’ll see where they open Monday. We could be in for a few rocky days.
Of note is that there is now room for the Fed inaction and stock futures still fell knowing that (futures were open, while the cash market was closed all day Friday), so it’s not all about the Fed any longer if we see selling continue over the next week. Perhaps the economy will have to stand or fall on its own for the first time in years. The Federal Reserve seems hell-bent on raising rates a bit, perhaps 25-50 basis points (0.25-0.50%) to get off zero rates.
Since the rest of the world’s growth seems to be improving marginally here and there (e.g. Eurozone, China and Korea), U.S. growth will be helped. A further fall in U.S. Treasury rates will draw more money out of the U.S. dollar (down dollar), which would then help U.S. multinationals improve their sales. The U.S. stock markets should recover in time despite a temporary setback in Q1.
And now the charts for the week:
SP500 Index (SPX, SPY; click the chart to enlarge it):
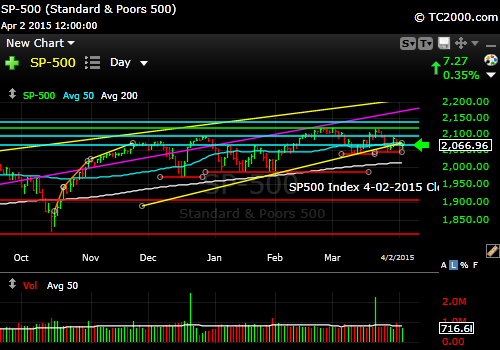
SP500 Index rallies a bit off the prior low.
To find out what I’m doing, including buys and sells, please follow me here: Follow Me on Twitter®. Follow Me on StockTwits® You don’t have to make comments yourself to read my messages.
Russell 2000 U.S. Small Cap Chart (RUT, IWM; click the chart to enlarge it): Small caps continue to outperform large caps.
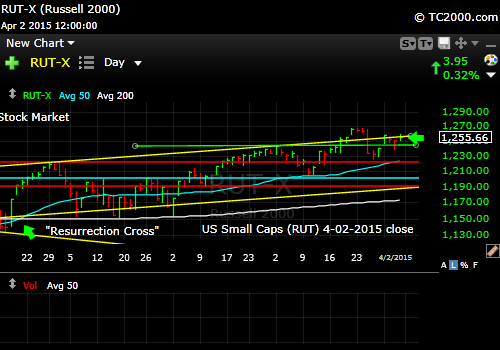
Small caps still stronger than the SP500 Index.
The Gold ETF Chart (GLD; click to enlarge the chart): (see above and below for predictions) Gold seems to have found a floor for the time being at least.
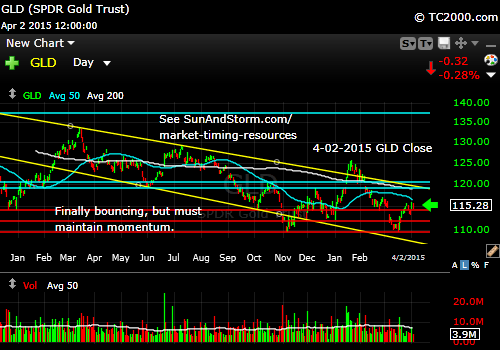
Gold holding up on Central Bank easing worldwide.
Please Click the TNX Chart to enlarge it (see related ETFs, TLT, UBT and TBT): The 10 year yield did in fact fall back below 19.30 as predicted.
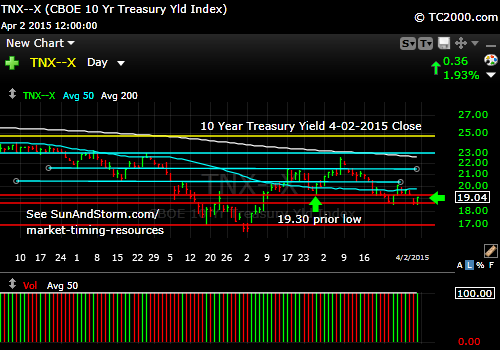
Rates will head lower.
CONCLUSIONS: The rise of TLT will likely continue Monday. Yields were falling after the 8:30 am announcement of the employment numbers. Stocks may struggle for a few days or weeks depending on how poor forward guidance is during the upcoming earnings season. Gold could keep some momentum with falling rates AND a falling U.S. dollar. The U.S. dollar’s course is harder to predict than rates over of the next few months for reasons discussed in detail in last week’s post. That means gold’s course could surprise us as well as it generally will move opposite the U.S. dollar as long as worldwide panic is not occurring.
For now, we’ll stay with U.S. stocks through the near-term bumps and with long term U.S. Treasuries (TLT). We hold a standard 5% in gold long term as insurance, but have no trading position on and won’t until the dollar’s course has clearly shifted to the downside.
I cover foreign markets on social media (see links above) and in my monthly newsletter. Note that the newsletter is now closed again to new subscriptions: Join the Wait List to Join the Newsletter as a Loyal Subscriber, Opening again for the July. 5th issue. If you join and don’t read the newsletter, you will be deleted. I don’t publish to non-readers as other newsletters do. Stay tuned here in the meantime and follow all the action via the Twitter® and StockTwits® links above.
Be sure to visit the website at: Sun and Storm Investing™
Standard Disclaimer: It’s your money and your decision as to how to invest it.
I thank Worden Brothers for the charting system I use to post these charts. If you want to know more about the charting system I use every day, go to my “Other Resources” page here: Other Resources It makes it much easier to follow along with me if you can see the charts and manipulate them on your own computer. It’s a great investment to have an excellent charting system. Check it out with a free trial at the link above.
Copyright © 2015 By Wall Street Sun and Storm Report, LLC All rights reserved.
