A Market Timing Report based on the 2-26-2016 Close, published Sunday February 28th, 2016
I deliver focused comments on the markets. These are supplemented with “Tweets/StockTwits” (see links below).
2-29-1016 GLD UPDATE: Gold does fine with the dollar either flat to falling. The only time the dollar and gold tend to move up together is when there is financial panic. That is not happening right now. With the Fed off the rate hike pedal, the dollar should stay flat or fall a bit. If it falls too much, the Fed will have stagflation on its hands in the near term. IF we see the U.S. economy strengthen, the dollar will strengthen and Federal Reserve rate hikes come back on the table, and gold is likely to fall unless there is growth WITH high inflation (negative real interest rates).

Gold does fine with dollar flat to falling.
1. SP500 Index: The stock market bounce went a bit further this week, scaling the prior lower daily high, though it is not much above it. This week the negative spread of the Bull% – Bear% of AAII.com Individual Investor Sentiment rose to -0.2%, so that the second “Sentiment Shock” that I defined here: “SENTIMENT SHOCK™” has yet to occur. We are now still waiting to see whether the shock that hit the market during the two week period beginning with 1-13-2016 will give rise to yet another shock. If you are Bullish, you don’t believe that there will be a second shock. If we see another, the odds are that this is a Bear that will take down the large caps along with the small caps that still remain in a Bear market.
What it hinges upon is simple and I said everything on Twitter at the end of the week, so you can read about it there (link below). In brief, if some are right that we are headed into a recession, the losses in the SP500 Index will steepen to exceed 20%. The recent low of 1810.01 was already 14.8% from the all time high of 2134.71. If you believe we are NOT headed into a recession and that the dip in GDP is just a hesitation in the recovery, stay fully invested. If you believe otherwise, consider cutting your exposure at a certain level of loss from the close Friday. I believe that the economy will slow further regardless of whether the U.S. enters a full recession or not, so I want to have some cash to buy stocks lower; however, I’m willing to change my mind.
Currently I’m at 70% of my maximum worldwide equity exposure. If you are in your 20’s and have an 80% exposure to stocks, your exposure would now be down to 56% as an example IF you decided to mirror my exposure level. I held up to a maximum 135% of my usual maximum equity exposure using excess cash when the market was behaving better. Not any longer.
I report my equity exposure level regularly on Twitter each time I make a move. You must make your own decisions and be willing to change your mind if you are wrong. Missing a big fall in the market is a good thing, but so is participating in a big rally. Manage your risk and live with your results.
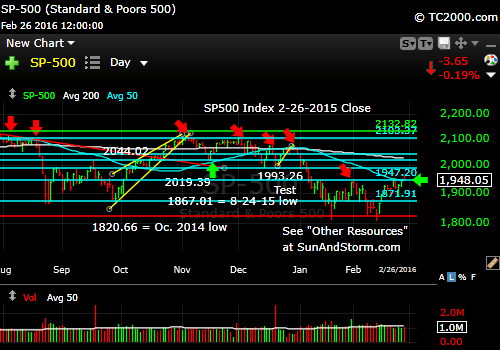
SP500 Index rally: Is it durable?
Please keep up to date at Twitter and StockTwits: See my messages on Twitter® Follow Me on Twitter®. Follow Me on StockTwits®).
2. “U.S. Small caps failed to scale 1040 at the end of January, and remain in a Bear market.” We’re still waiting for the small caps to rise above that 1040 level. If they do, it would be Bullish for the entire market, so pay attention to their performance this week.
Russell 2000 U.S. Small Cap Index (click chart to enlarge; RUT, IWM):

Small caps still in a Bear market state.
3. Gold: Although the rally is OK so far despite the slight pullback, gold needs another boost soon to maintain momentum. Preserve at least half of your profits if you bought when I said “buy some damn gold if you have none.” You can always rebuy it. If you see the gold rally sputter quickly, get ready for more Federal Reserve rate hikes.
Gold ETF (click chart to enlarge; GLD):

Gold hesitating in a rally.
4. U.S. 10 Year Treasury Note Yield (click chart to enlarge; TNX,TYX,TLT,TBF): Treasuries came off a bit this week as the “risk-on” traders were at work. I would still expect rates to stay low to lower for the rest of 2016 until U.S. GDP turns around (see caption of chart below).
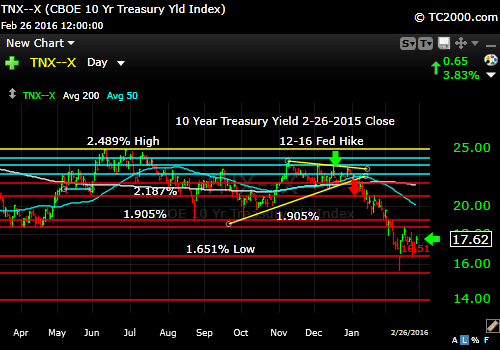
10 Year Treasury Note Yield should stay below 1.845% (Spring 2015 low) or it means the market sees a stronger economy.
Stay with me throughout the week for the LATEST via the links to Twitter/StockTwits above. Feel free to comment, retweet etc. to spread the word.
Be sure to visit the website at: Sun and Storm Investing™
Standard Disclaimer: It’s your money and your decision as to how to invest it.
I thank Worden Brothers for the charting system I use to post these charts. If you want to know more about the charting system I use every day, go to my “Other Resources” page here: Other Resources It makes it much easier to follow along with me if you can see the charts and manipulate them on your own computer. It’s a great investment to have an excellent charting system. Check it out with a free trial at the link above.
Note that the newsletter is now CLOSED to new subscriptions: Join the Wait List to Join the Newsletter as a Loyal Subscriber, Opening again for the April 3rd issue. If you join and don’t read the newsletter, you will be deleted. Why? I don’t publish to non-readers as other newsletters do. I surround myself with committed people who value what we are doing. Stay tuned here in the meantime and follow all the action via the Twitter® and StockTwits® links above.
Copyright © 2016 By Wall Street Sun and Storm Report, LLC All rights reserved.
