A Market Timing Report based on the 7-15-2016 Close, published Sunday July 17th, 2016
I deliver focused comments on the markets. These are supplemented with “Tweets/StockTwits” (see links below).
1. SP500 Index: Earnings season has arrived, and the SP500 Index is now 4 days over the prior all time high. There is a common understanding among market timing technical analysts to look for 3 days above a breakout to confirm it. That idea never precludes a reversal! Still, there is no reason the SP500 Index cannot make more progress given sufficient earnings this quarter.
Bears should note that earnings are down 2.5% and revenues are up 0.5% vs. the same period last year. Here are the numbers: Start of Q2 Earnings Season: The Stats
You’ll note that analysts are expecting a rise of earnings to about flat from negative for Q3 and a much bigger boost going into the holiday quarter of 2016 and into 2017. Those expectations could be pressured if worldwide slowing continues. The election may throw some curve balls too. The drip, drip, drip of terrorist attacks could weigh on consumers eventually should it continue. If you expect the acceleration of earnings, you should be long stocks and just hang on for the ride.
The longer term good news may be that our government is finally going to move into action again, hopefully in ways that support rather than cripple the economy.
A final Bullish note. I have read from two sources that if the SP500 treads water for a year and then breaks out, further double digit gains are likely. Keep that in mind before you throw in the towel.
What have I done? I have lightened stock exposure just a bit in part by shorting small cap stocks. I added a very well valued utility in the form of a long term options play. I trimmed some gold miner exposure to take substantial profits and will look for a place to re-enter lower. See below for my move in the bond realm. I sold some. Check my Twitter/StockTwits feeds (links below) for information on my current exposure level and adjust it according to your own view.
SP500 Large Cap Index (click chart to enlarge; SPX, SPY):
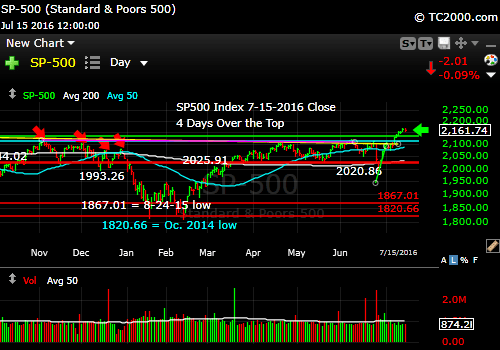
SP500 Index is 4 Days “Over”
Survey Says! Sentiment this week among individual investors (AAII.com) showed a Bull minus Bear percentage spread at +12.45% this past Wednesday [over 40% Neutrals is Bullish for market timing 6 months out]).
| 7-14-16 12 am CT close to poll | Bulls 36.87% | Neutrals 38.71% | Bears 24.42% |
As I explained last week, we should expect more positive sentiment at a top now moving on to new highs. The market may pull back a bit if earnings continue on the light side against the current backdrop of higher employment with rising wages in the most recent reports.
I told you exactly what your choices were last week (see prior issue link to upper right). You must make your own decisions, but you can view my current exposure to the market here at the following links.
Please keep up to date at Twitter and StockTwits: See my messages on Twitter® Follow Me on Twitter®. Follow Me on StockTwits®).
2. U.S. Small Caps: I decided to short the IWM given the likelihood that earnings could continue to be tough for the small caps. You can follow that trade on the above links. I am using the short position to offset some SP500 Index long exposure.
Russell 2000 U.S. Small Cap Index (click chart to enlarge; RUT, IWM):
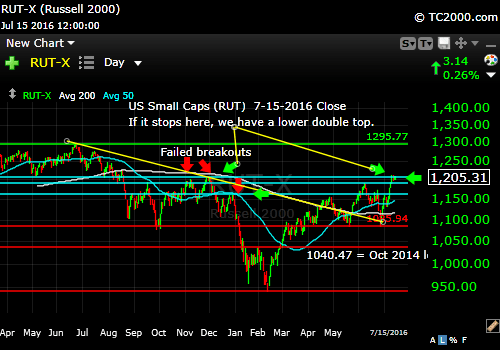
Small caps COULD come off from this lower double top.
3. Gold: The gold rally is pausing. Follow the dollar chart just below the gold chart. I would begin buying here if you have no gold exposure, but otherwise wait for it to hit those up trend lines in yellow you see on the chart below OR wait until you see the U.S. dollar rally break down. I sold some of my gold stock exposure making about 28.5% on my capital at risk in an options trade. The trade made me a credit when I first opened it, which is a great way to enter the market (if you are invested in the right direction!).
Gold ETF (click chart to enlarge the chart; GLD):

Gold is on pause. Watch the dollar.
UUP (U.S. Dollar Index ETF, market timing chart):

US dollar will determine gold’s next move.
4. U.S. 10 Year Treasury Note Yield (TNX): This week we saw a REVERSAL of the prior break to a new low below the 2012 low. The below is a weekly chart. The bounce in rates was hard and fast but it could extend still higher. GDP is not going to be that bad for Q2 and wages are rising, so the market is going to be a bit afraid of the Fed over the next 6 months despite the gloom and doom talk we previously heard around Brexit.
The bond move was very stretched, so I let go of about 25% of my municipal bond position which is 50% of my trading position in munis.
My sense so far is that we are muddling through. Markets can do OK in muddle-through conditions. If you believe those predicting an all out recession, you should substantially decrease your exposure in stocks. Recessions are stock market killers. I have taken a middle ground so far, lowering my exposure a bit by moving some assets to cash and adding a small trading short small cap position.
U.S. 10 Year Treasury Note Yield (click chart to enlarge; TNX,TYX,TLT,TBF):

Rates rise off major low reversal.
Stay with me throughout the week for the LATEST via the links to Twitter/StockTwits above. Feel free to comment, retweet etc. to spread the word.
Be sure to visit the website for more general investing knowledge at:
Standard Disclaimer: It’s your money and your decision as to how to invest it.
I thank Worden Brothers for the charting system I use to post these charts. If you want to know more about the charting system I use every day, go to my “Other Resources” page here: Other Resources It makes it much easier to follow along with me if you can see the charts and manipulate them on your own computer. It’s a great investment to have an excellent charting system. Check it out with a free trial at the link above.
Note that the newsletter is now CLOSED to new subscriptions: Join the Wait List to Join the Newsletter as a Loyal Subscriber, Opening again for the October 2nd issue. If you join and don’t read the newsletter, you will be deleted. Why? I don’t publish to non-readers as other newsletters do. I surround myself with committed people who value what we are doing. Stay tuned here in the meantime and follow all the action via the Twitter® and StockTwits® links above.
Copyright © 2016 By Wall Street Sun and Storm Report, LLC All rights reserved.
