A Market Timing Report based on the 7-08-2016 Close, published Sunday July 10th, 2016
I deliver focused comments on the markets. These are supplemented with “Tweets/StockTwits” (see links below).
UPDATE 7-11-2016 After the Close: Where Will Gold Go Now?
I wanted to update this post with information on the market timing relationship of the US dollar vs. gold and their relationship to economic growth. First read this: When Does Gold Shine
Then come back and look at the recent market trend: You see that gold has been rising while the US. dollar has been falling. That was until Brexit hit. Remember that European panic mode is one time that gold and the U.S dollar can go up together.
The tricky part now is that if stocks continue to climb WHILE the economy improves (let’s see what earnings show…), then interest rates will climb as the market anticipates Fed action, positive real rates will result, the dollar will climb further, and gold will sell off. Only in the case of European financial panic (still possible if other countries leave the EU), will gold continue climbing with the US dollar.
Alternatively, if earnings and forward predictions stink, the dollar and US interest rates will fall further and gold will love it. This is how we do market timing on the gold market.

Market timing the U.S. dollar vs gold (yellow line).
1. SP500 Index: Despite Brexit, the market has risen over the last two weeks and despite the fact that the longer term average of new jobs created each month is still in a downtrend due to the prior extremely weak numbers, the 287,000 jobs created this past month fed Bull fever on Friday. In market timing terms, we’re nearly back to the prior all time high. Admittedly, the rather high jobs number should raise some concern for Bears that U.S. economic activity is not quite as bad as they were thinking. It will take several more months of positive data like that to turn the trend around.
That said the picture remains very mixed. With crashing rates around the world, I don’t expect growth to be picking up in a big way any time soon. If sluggishness around the world is reflected in the earnings season, which begins officially after the close on Monday, the market may give us an opportunity to buy lower. Check my Twitter/StockTwits feeds (links below) for information on my current exposure level and adjust it according to your own view.
SP500 Large Cap Index (click chart to enlarge; SPX, SPY):
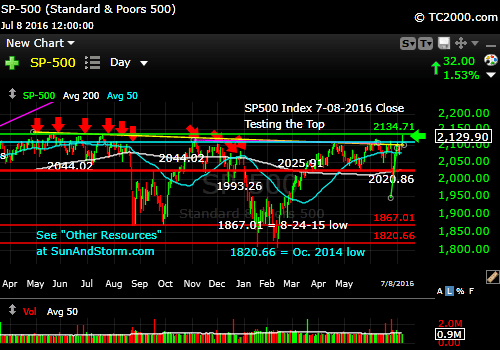
Nearly back to all time high.
Survey Says! Sentiment this week among individual investors (AAII.com) showed a Bull minus Bear percentage spread at + 4.41% this past Wednesday (Bulls 31.06% and Bears 26.65% with Neutrals at 42.29% [over 40% Neutrals is Bullish for market timing 6 months out]). We should expect more positive sentiment at a top. This means there is potential for more Bullish action, especially given the high neutral reading; however, if earnings season delivers more weak results and forward guidance does not indicate an uptick in economic activity, the market will fall and give us a better entry point as I said above. We are at a market timing pivot point.
So what do you do when the market is at a top? First, it’s a ridiculous place to buy stocks. Buy when there is fear, not when investors are more complacent, unless you are simply averaging in over time. Second, you could sell a bit if you are now overexposed to the market and redeploy the assets to other investments, or hold a bit more cash until the SP500 Index corrects. Third, you could sit tight and only sell some stock exposure after the market begins pulling back a few percentage points from the high. Selling once there is a high level of fear is as dumb as buying at a top.
Please keep up to date at Twitter and StockTwits: See my messages on Twitter® Follow Me on Twitter®. Follow Me on StockTwits®).
2. U.S. Small Caps: Be careful of high beta stock exposure going into earnings season. Small caps are higher beta on average.
Russell 2000 U.S. Small Cap Index (click chart to enlarge; RUT, IWM):\
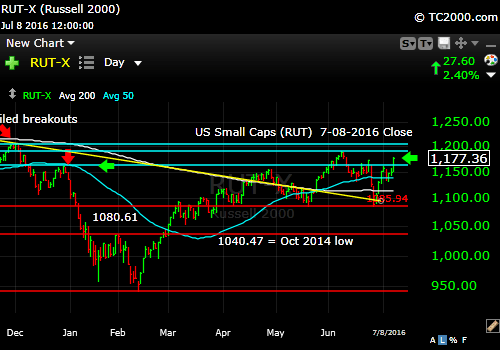
Small caps keep rallying despite the lack of GAAP earnings on a trailing 12 month basis.
3. Gold: The gold rally is still under way, but buy pullbacks as things are still stretched. Chasing rallies is in general a poor strategy. If you must chase, buy just a little and then add on the dips and at the bases of consolidations. The chart below is a weekly chart.
Gold ETF (click chart to enlarge the chart; GLD):

If you miszed it, you missed it. Be patient now.
4. U.S. 10 Year Treasury Note Yield (TNX): That was quick! Read my note from last week in which I said brand new lows below the 2012 low were probable. This is not good news for economic growth over the longer term. Rising rates accompany economic growth.
U.S. 10 Year Treasury Note Yield (click chart to enlarge; TNX,TYX,TLT,TBF):

10 Year Note Yield falls below the 2012 low.
Stay with me throughout the week for the LATEST via the links to Twitter/StockTwits above. Feel free to comment, retweet etc. to spread the word.
Be sure to visit the website for more general investing knowledge at:
Standard Disclaimer: It’s your money and your decision as to how to invest it.
I thank Worden Brothers for the charting system I use to post these charts. If you want to know more about the charting system I use every day, go to my “Other Resources” page here: Other Resources It makes it much easier to follow along with me if you can see the charts and manipulate them on your own computer. It’s a great investment to have an excellent charting system. Check it out with a free trial at the link above.
Note that the newsletter is now CLOSED to new subscriptions: Join the Wait List to Join the Newsletter as a Loyal Subscriber, Opening again for the July 3rd issue. If you join and don’t read the newsletter, you will be deleted. Why? I don’t publish to non-readers as other newsletters do. I surround myself with committed people who value what we are doing. Stay tuned here in the meantime and follow all the action via the Twitter® and StockTwits® links above.
Copyright © 2016 By Wall Street Sun and Storm Report, LLC All rights reserved.
