A Market Timing Report based on the 8-12-2016 Close, published Sunday August 14th, 2016
I deliver focused comments on the markets. These are supplemented with “Tweets/StockTwits” (see links below).
UPDATE 8-16-2016: Market timing the China ETF vs. other BRIC Members
FXI is the (Hong Kong listed Shares) FXI, which I’ve plotted vs. rest of BRIC (Brazil EWZ, Russia RSX, India EPI) and overall emerging market index (VWO) since the 2011 low (dividends not accounted for). Although Brazil (EWZ) has rapidly reversed toward the mean from a huge fall, it is still trailing the other three ETFs.
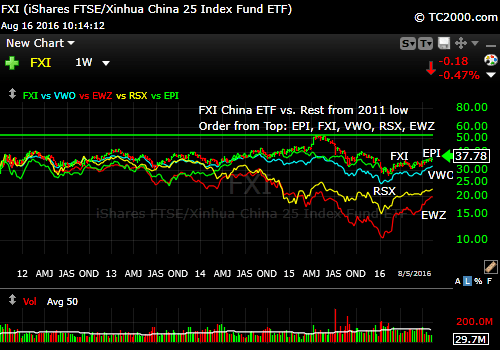
India and China are on top since the 2011 low in FXI.
UPDATE 8-15-2016: SPY vs. the World since Brexit: I examined the market timing of numerous markets since Brexit (just after the fall; chart starts on 6-27-2016) and here are the results: China wins (H shares, FXI). Gold loses in relative terms for this period (ignore that green arrow ;)).

Market timing SPY (plus IWM (US small caps) and IJH (US mid caps) vs. the World
1. SP500 Index: The index is holding onto a new high despite falling corporate profits. Of course, if the Atlanta Fed’s very large 3.5% GDP number holds up for Q3, profits may rise and drive down PE’s. At the moment the U.S. definitely remains a favored market for investors, which is likely why Brexit was such a short lived event. Compare that to the Japanese tsunami HERE. In that case, selling made sense if you were willing to buy back lower, our process of “passive shorting.”
SP500 Large Cap Index (click chart to enlarge; SPX, SPY):
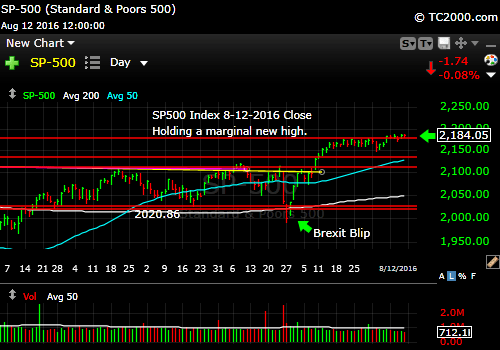
SP500 Index Holds Marginal New High
Survey Says! Sentiment this week among retail investors (AAII.com) showed a Bull minus Bear percentage spread of +4.53% that once again barely moved vs. last week [over 40% Neutrals is Bullish for market timing 6 months out]). Last week the Bull minus Bear spread was 3.0% and the prior week it was 2.8%. This is despite the achievement of all time highs. That is Bullish! Typically at tops everyone is Bullish and the Uber driver is talking about his last stock trade (it used to be cab drivers!).
| 8-10-16 close to poll | Bulls 31.29% | Neutrals 41.95% | Bears 26.76% |
Keep up to date at Twitter and StockTwits where a combined 18,321 people are joining in. Thank you for your interest! Twitter® Follow Me on Twitter®. Follow Me on StockTwits®).
2. U.S. Small Caps: Small caps are holding up well despite the failure of corporate profits to materialize in this group. The Wall Street Journal still reports the PE ratio of the small caps to be “nil,” even after most of earnings season has passed us by. We will continue to favor mid caps to small caps until this turns around.
Russell 2000 U.S. Small Cap Index (click chart to enlarge; RUT, IWM):

Small caps slip and recover.
3. Gold: Gold will continue to be under pressure if the Fed is seen as getting closer to raise rates. With Atlanta Fed GDP estimates of 3.5% for Q3, the Fed won’t be able to hold off forever on raising rates if it chooses to believe its own data. That it may not do, given the fact that the chair is a devout Democrat. Not a political comment, just a factual point that will likely keep rates steady until the December meeting or later.
If you are in the “GDP-slowing camp,” then you are raising cash right now in anticipation of another market decline. You can see how invested I am via the social media links above. My view is that the stock market finds the current “Muddle Along Economy” adequate. I suspect the market also likes the prospects of Trump losing the election, so world trade is not disrupted. Again, not a judgment of policy choice, just the facts!
Gold ETF (click chart to enlarge the chart; GLD):
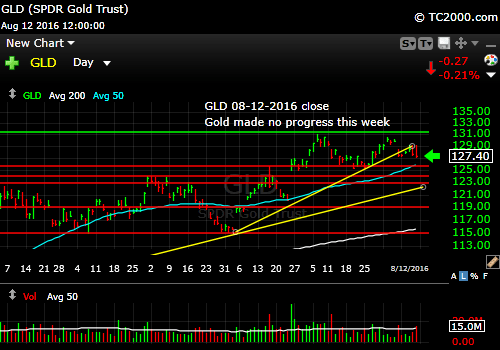
Gold stalls as the economy grows slowly.
4. U.S. 10 Year Treasury Note Yield (TNX): Rates are still staying low as growth is not spectacular. Corporate profits were down about 5% this past quarter despite “beating expectations.” This allows the Fed to keep rates low in the context of low rates around the world.
U.S. 10 Year Treasury Note Yield (click chart to enlarge; TNX,TYX,TLT,TBF):

Rates ease.
Stay with me throughout the week for the LATEST via the links to Twitter/StockTwits above. Feel free to ask me questions, comment, retweet etc.
Be sure to visit the website for more general investing knowledge at:
Standard Disclaimer: It’s your money and your decision as to how to invest it.
I thank Worden Brothers for the charting system I use to post these charts. If you want to know more about the charting system I use every day, go to my “Other Resources” page here: Other Resources It makes it much easier to follow along with me if you can see the charts and manipulate them on your own computer. It’s a great investment to have an excellent charting system. Check it out with a free trial at the link above.
Note that the newsletter is now CLOSED to new subscriptions: Join the Wait List to Join the Newsletter as a Loyal Subscriber, Opening again for the October 2nd issue. If you join and don’t read the newsletter, you will be deleted. Why? I don’t publish to non-readers as other newsletters do. I surround myself with committed people who value what we are doing. Stay tuned here in the meantime and follow all the action via the Twitter® and StockTwits® links above.
Copyright © 2016 By Wall Street Sun and Storm Report, LLC All rights reserved.

David, why am I taken to Wourld Press when I like the Market Timing Blog?
The site is hosted by WordPress as a subdomain of the main site. DM me on Twitter if that is not clear. 😉