A Market Timing Report based on the 8-05-2016 Close, published Sunday August 7th, 2016
UPDATE 8-08-2016: See GLD Update just above the GLD chart.
I deliver focused comments on the markets. These are supplemented with “Tweets/StockTwits” (see links below).
1. SP500 Index: If you are running behind this market, you need to catch up on the market timing context here: My Prior issue On Friday we found out in the U.S. employment report that the US jobs number for July was 255,000 vs. 185,000 expected. That surprised the market in a good way, with the SP500 Index making a new high as the chart shows below.
The market can take this in two ways:
1. It can decide that the slowdown in GDP is going to reverse as discussed last week and rally based on the assumption of rising GDP and earnings. The market will rally.
2. It can decide that the employment strength over the past two months is just a blip in a downtrend and that the Fed may mistakenly raise interest rates into a world slowdown and trigger a U.S. recession. The market will correct 5-10%.
My favored scenario is a move up followed by a correction (loss of all new gains), and then a rally into greater certainty about the Presidential election (prayer needed!). After you review the chart, take a look at investor sentiment.
SP500 Large Cap Index (click chart to enlarge; SPX, SPY):
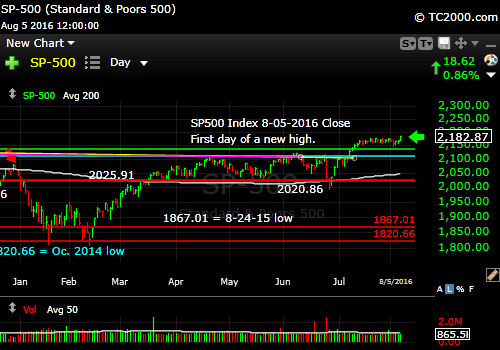
New high on strong jobs.
Survey Says! Sentiment this week among retail investors (AAII.com) showed a Bull minus Bear percentage spread of +3.02% that barely moved vs. last week [over 40% Neutrals is Bullish for market timing 6 months out]). At these levels there is plenty of room for sentiment to go in either direction, BUT the neutrals have the ball for the 6 month period Again: the odds according to AAII’s data of the market being higher in 6 months is better than 80%.
| 8-03-16 close to poll | Bulls 29.79% | Neutrals 43.44% | Bears 26.77% |
We said last week we’d follow the market, so we did. I upped my exposure level more to equities as you can read on the two social media sites that I use. Keep up to date at Twitter and StockTwits where a combined 18,020 people are joining in. Thank you for that! Twitter® Follow Me on Twitter®. Follow Me on StockTwits®).
2. U.S. Small Caps: I successfully closed out my short U.S. small cap market timing position this past week on the swoon, very close to the low. These things are always educated guesses, but the education part of it is what requires the most work. As long as we continue to buy lower and sell higher, we’ll do well. Or as I like to say: “Buy fear, sell greed.”
We buy when investors are becoming scared and sell when they are too complacent. The reason I feel the market could surprise to the upside whether that is immediately, or as if it’s as I suspect a few more weeks or a couple of months from now, is that investors are in a confused/doubtful state as the high neutral sentiment shows. That is NOT the sentiment you see at highs. At highs investors become rabidly Bullish. We are no where close to that place now.
That said, the economy (GDP) must strengthen soon for the small caps to continue to outperform large caps as they have since the February 2016 low. We’ve had some mid cap exposure, which has allowed us to match small cap performance with less risk (better GAAP earnings!).
Russell 2000 U.S. Small Cap Index (click chart to enlarge; RUT, IWM):
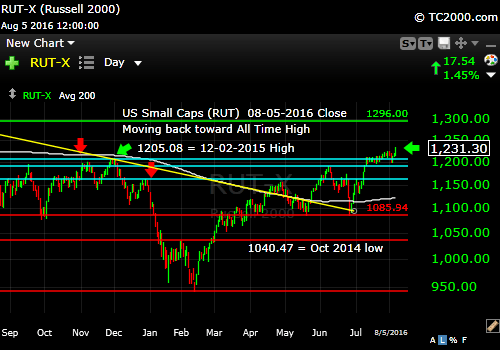
The small caps are headed higher again.
3. Gold: Gold did pull back a bit as I warned last Sunday it could based on firmer economic numbers. The risk is higher rates. For why that occurs, please review last week’s issue just above the gold chart (link above or to upper right). I will likely wait longer for the new enthusiasm to die down in the stock market before buying more gold. We’ll also watch our profits and try to give back less than 50% of profits. The breach of that up trend line (highest yellow line) is a warning.
UPDATE 8-08-2016: On short term market timing charts, GLD looks like it’s due another drop to around 125.11-125.31. A bounce is likely to occur from there due to the amount of support at that level. I will reassess the market there and let you know via Twitter/StockTwits whether it is a good buying point. If we don’t get there, we’ll find another entry point along the way. The key is to have a core position in my opinion that is a bit larger than our usual allocation.
Gold ETF (click chart to enlarge the chart; GLD):
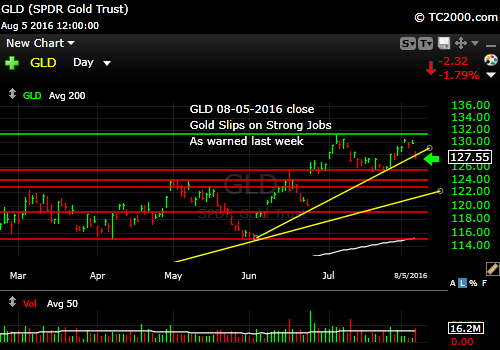
Gold hit on hot jobs number.
4. U.S. 10 Year Treasury Note Yield (TNX): U.S. 10 Year Treasury Note Yield (click chart to enlarge; TNX,TYX,TLT,TBF):
Rates spiked up on the jobs report as they should have. A stronger economy supports higher interest rates. There is more upside for now and this will strengthen the U.S. dollar and hurt gold.
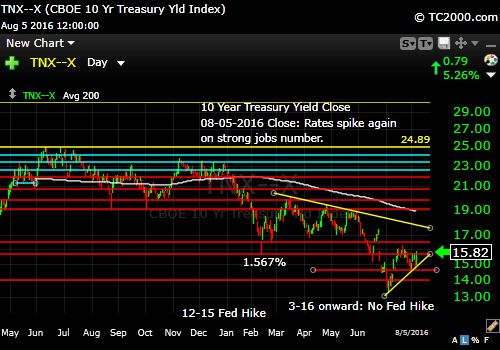
Rates spike on jobs report.
Stay with me throughout the week for the LATEST via the links to Twitter/StockTwits above. Feel free to comment, retweet etc. to spread the word.
Be sure to visit the website for more general investing knowledge at:
Standard Disclaimer: It’s your money and your decision as to how to invest it.
I thank Worden Brothers for the charting system I use to post these charts. If you want to know more about the charting system I use every day, go to my “Other Resources” page here: Other Resources It makes it much easier to follow along with me if you can see the charts and manipulate them on your own computer. It’s a great investment to have an excellent charting system. Check it out with a free trial at the link above.
Note that the newsletter is now CLOSED to new subscriptions: Join the Wait List to Join the Newsletter as a Loyal Subscriber, Opening again for the October 2nd issue. If you join and don’t read the newsletter, you will be deleted. Why? I don’t publish to non-readers as other newsletters do. I surround myself with committed people who value what we are doing. Stay tuned here in the meantime and follow all the action via the Twitter® and StockTwits® links above.
Copyright © 2016 By Wall Street Sun and Storm Report, LLC All rights reserved.
