A Market Timing Report based on the 9-30-2016 Close, published Sunday October 2nd, 2016
I deliver focused comments on the markets. These are supplemented with “Tweets/StockTwits” (see links below).
UPDATE: 10-04-2016 Gold Breaks Immediate Support
GLD, the gold ETF, broke immediate support this morning, but now is testing the prior breakout. That has washed out some gains of course, but IF earnings come in and are unimpressive and IF employment underwhelms, gold may resume its rise. I consider the main threat to gold to be the economy (see link below by second GLD chart below). Follow the economic recovery or the lack thereof.

Gold testing prior breakout after a break of immediate support.
And now back to this week’s market timing issue…
1. SP500 Index: You’ll see in the chart below that the SP500 Index is now just above the “Vibrational Range” that it was fighting with, and now is playing with the 50 day moving average. More progress is possible, but there are landmines ahead in the next 36 days.
I don’t expect great things until the election is over or when the market is sure of the winner, which looks like it will not be until November 8th, with a nuance I’ll get to momentarily. Like it or not, the market expects and wants a Clinton win that represents the status quo and fears the trade restrictions Trump may impose on the U.S. economy. I expect the market to continue upward if the election appears to be going Clinton’s way. At this point, she has a sizable Electoral Collage lead, and a Trump win would be a major upset. You can make your own predictions HERE.
Earnings season, which will be on weak side begins with Alcoa (AA) on 10/10/2016 after market close just 8 calendar days away. “Weakish” results are OK for the overall results as long as guidance is sufficiently optimistic for Q4. Too weak and recession fears arise. Make sure you exit any positions that are failing to make the revenue and earnings grade. Consider re-deploying the exposure to an equivalent index fund if you want to keep your overall exposure to the market the same.
U.S. Employment numbers come out this Friday and could move the market down if they are too high. The Bloomberg consensus is 168,000 jobs for September. ADP Employment comes out Wednesday, and could inflect things early if too high.
SP500 Large Cap Index (click chart to enlarge; SPX, SPY):

Above prior vibrational range now fighting 50 day moving average.
Survey Says! Sentiment this week among individual investors (AAII.com) showed a Bull minus Bear percentage spread that was -13.11%, in other words tilted toward Bearishness, but little changed from last week. The percentage of “Neutrals” is now just below 40% (above 40% Neutrals is Bullish on a market timing basis for higher prices out 6 months from today per AAII studies of their statistics).
From last week as nothing changed meaningfully: This is again not an extreme. Extremes occur at spreads of 20-30% toward Bearishness or more. Stay flexible, but above all, “Buy Fear, not Greed” as is one of our mottoes.
| 9-22-16 12 am close to poll | Bulls 24.00% | Neutrals 38.89% | Bears 37.11% |
Keep up to date at Twitter and StockTwits where a combined 20,360 people are joining in. Thank you for your interest!
Twitter® Follow Me on Twitter®. Follow Me on StockTwits®).
2. U.S. Small Caps: Be sure to follow the advice above and jettison small cap stocks that won’t measure up this earnings season.
Russell 2000 U.S. Small Cap Index (click chart to enlarge; RUT, IWM):
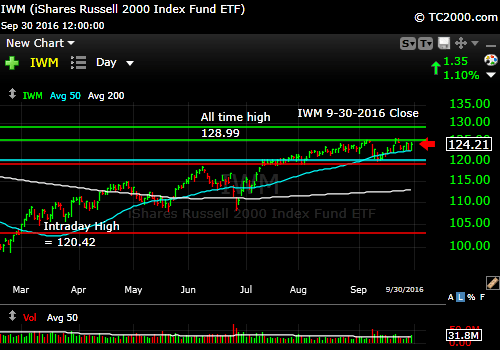
Small caps still holding up despite poor earnings over the past year, but we’ll see new results soon. Get ready. (see text)
3. Gold: Gold is still holding above an important base. I’ve covered this before, but the economy is a major key to gold’s near term success. A hot economy means trouble for gold as the Federal Reserve will be raising rates to prevent inflation and if they are ahead of the curve, gold will fall.
If the market starts to fear multiple rate hikes, despite softness of the economy, gold will suffer. If the economy actually DOES pick up substantially and the Fed raises rates slowly, gold will also suffer. You can read more here if you have not: When Gold Shines
Gold ETF (click chart to enlarge the chart; GLD):
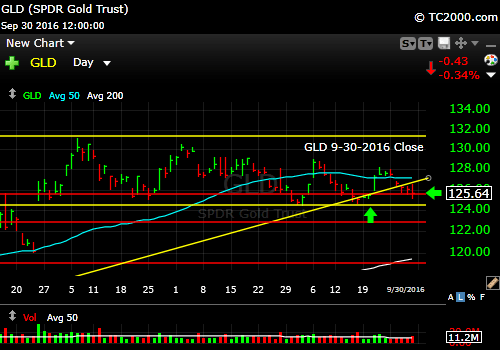
Gold holding above a base, which must continue to hold!
4. U.S. 10 Year Treasury Note Yield (TNX): Rates have endured some upward pressure of late, but are still contained below the yellow triangle shown. If employment disappoints this week, they will drop once again.
U.S. 10 Year Treasury Note Yield (click chart to enlarge; TNX,TYX,TLT,TBF):
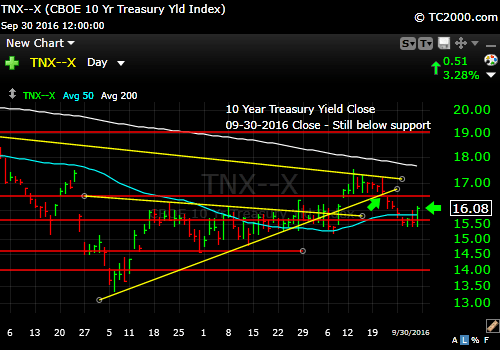
Rates moved up a bit, but are still below the triangle.
Stay with me throughout the week for the LATEST via the links to Twitter/StockTwits above. Feel free to ask me questions, comment, retweet etc.
Note that ALTHOUGH my newsletter is now CLOSED to new subscriptions: You can Join the Wait List to Receive the Newsletter as a Loyal Subscriber, Opening again for the January 1st issue. Note that if you join and don’t read the newsletter, you will be deleted. Why? I don’t publish to non-readers as other newsletters do. I surround myself with committed people who value what we are doing. Stay tuned here in the meantime and follow all the action via the Twitter® and StockTwits® links above.
Be sure to visit the website for more general investing knowledge at:
Standard Disclaimer: It’s your money and your decision as to how to invest it.
I thank Worden Brothers for the charting system I use to post these charts. If you want to know more about the charting system I use every day, go to my “Other Resources” page here: Other Resources It makes it much easier to follow along with me if you can see the charts and manipulate them on your own computer. It’s a great investment to have an excellent charting system. Check it out with a free trial at the link above.
Copyright © 2016 By Wall Street Sun and Storm Report, LLC All rights reserved.
