A Market Timing Report based on the 4-18-2017 Close, published Tuesday April 18, 2017
I deliver focused comments on market timing once or twice a week. These are supplemented with daily “Tweets/StockTwits” (see links below).
1. SP500 Index: The index is sagging but not broken on a market timing basis. The market ran up fast after the election. I anticipated that and added exposure prior to the election in order to be fully invested. My theory was that the market just wanted the uncertainty to end, and it would end either way. President Trump’s entry was more exciting with the election evening dive, but the recovery was swift. I’ve continued to add exposure slowly on pullbacks, most recently adding some small cap exposure.
If Q1 GDP is as bad as the Atlanta Fed is guesstimating (0.5%!), the market could sink further prior to the actual enactment or visibility thereof of Trump economic policies, both tax reform for companies and for individuals. If GDP surprises to the upside by a big degree, the buying opportunity of today will be in the rear view mirror very quickly. We’ll be finding out the answer on GDP at the end of the month.
There is another looming set of issues…geopolitical. Any threat of war such as we are hearing about with North Korea gives the market gitters. Nuclear weapons are being discussed as an option by the insane Kim, who knows how to manipulate people. President Trump is not helping either by saying the prior tolerance of misbehavior won’t be his course. But what does that actually mean practically speaking?
President Trump has two options, both horrible really: conventional attack which will immediately imperil millions of South Koreans and 28,500 US troops at the DMZ. The second option is nuclear war which would only be started by Kim, but it’s obviously a horrible idea for both sides. I don’t believe either option is realistic and therefore my sense is that Trump is bluffing. If so, he’s trying to get leverage for negotiation via China to settle the whole thing down and contain North Korea’s aspiration to build an ICBM that can level Los Angeles with a nuclear weapon attached. But in the meantime, markets HATE uncertainty and the situation with North Korean needs to be overcome for the markets to be at ease.
Dropping the “Mother of all Bombs” on ISIS tunnel systems in Afghanistan actually named for real the “Massive Ordinance Air Blast,” also made the world a bit more on edge about the war with ISIS. The ISIS war is a chronic issue that the market has been willing to ignore. That would change if Trump puts American soldiers in harm’s way in large numbers. The markets would react negatively to a major new war effort in the Middle East involving our troops.

Off a retest low, but still waiting for Trump to succeed in enacting his plans.
We’ll continue to follow my 3 signals defined in early February HERE.
As of today the signals are still ALL off for a continued Trump Rally: STOCK SIGNAL: OFF. GOLD SIGNAL: OFF ( means gold is rallying). INTEREST RATE SIGNAL: OFF (means Treasuries/bonds are rallying).
Keep up-to-date during the week at Twitter and StockTwits (links below), where a combined 26,202 people are joining in…
Twitter® Follow Me on Twitter®. Follow Me on StockTwits®.
SP500 Large Cap Index (click chart to enlarge; SPX, SPY):
Survey Says! Sentiment of individual investors (AAII.com) showed a Bull minus Bear percentage spread of -8.41%, just a bit more Bullish than last week’s -11.32%. Buy the dips as long as investors are squeamish about stocks near the all time highs!
| Thurs. 12 am close to poll | Bulls 28.97% | Neutrals 33.64% | Bears 37.38% |
2. U.S. Small Caps: I bought a bit ahead of the retest, but the low has held. Buy low when you can. Obviously a breach of the top red line might lead to a bigger dip/correction. That would be an even better buying opportunity barring some sort of international disaster (a conventional war against North Korea for ex.).
Russell 2000 U.S. Small Cap Index (click chart to enlarge; IWM, RUT):

Also waiting! Buy the dips IMO.
3. Gold: Finally, gold was able to break out to a brand new recent high. That is impressive and says that investors are very hesitant, both about Trump’s prospects (I believe they are underestimating what he’ll be able to do – speaking without reference to politics!) as well as his handling of the geopolitical scene.
Gold ETF (click chart to enlarge the chart; GLD):
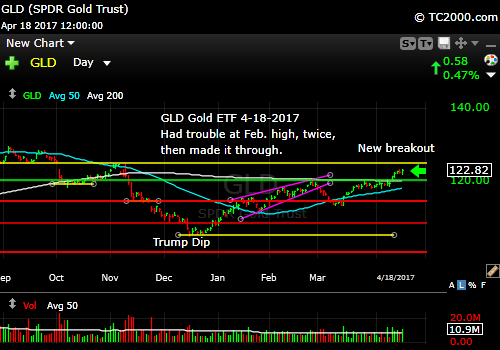
Another breakout amidst uncertainty at home and abroad.
4. U.S. 10 Year Treasury Note Yield (TNX): That white triangle we’ve been watching is a goner! Left behind as rates plunged! Notice election day on the chart below? We’re time traveling back to November 8th in market timing terms below the bottom white trend line. It is not what economic Bulls want to be seeing. Financial stocks don’t like this at all. You can look at any of the financials since the election or look at XLF (the financial sector of the SP500 Index) and see that it is testing the January 2017 low. The current breakdown in yields is a major disappointment for growth Bulls.
U.S. 10 Year Treasury Note Yield (click chart to enlarge; TNX, IEF, TYX,TLT,TBF):

Treasuries predicting a very slow economy.
Thank you for reading. Would you please leave your comments below where it says “Leave a Reply”… or feel free to ask a question…
Note: My monthly newsletter is now CLOSED to new subscriptions until late this year. I’ll let you know here if it reopens.
Be sure to visit the website for more general investing knowledge at:
Standard Disclaimer: It’s your money and your decision as to how to invest it.
I thank Worden Brothers for the charting system I use to post these charts. If you want to know more about the charting system I use every day, go to my “Other Resources” page here: Other Resources It makes it much easier to follow along with me if you can see the charts and manipulate them on your own computer. It’s a great investment to have an excellent charting system. Check it out with a free trial at the link above.
Copyright © 2017 By Wall Street Sun and Storm Report, LLC All rights reserved.

Thank you David! As always your work has made me a better investor.
Great to hear Charles! Especially from an already excellent investor!