A Market Timing Report based on the 4-07-2017 Open, published Sunday April 9, 2017 (well OK, 12:58 am Monday the 10th!)
I deliver focused comments on market timing once or twice a week. These are supplemented with daily “Tweets/StockTwits” (see links below).
This is a tax time special…long on charts, but short on words. The set-up is the same as last week, given the assumption that the low employment growth in March was a “one off” weak data point. The market is waiting for signs that Trump’s economic growth plans are going to manifest. We’ll continue to track the 3 market timing signals we’ve been watching since early February to show us the way.
1. SP500 Index: Off the all time high, but not by much.
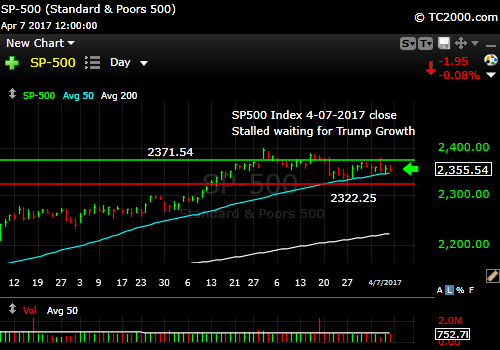
Stuck in a trading range.
Continue to follow my 3 signals defined in early February HERE.
As of today: STOCK SIGNAL: OFF. GOLD SIGNAL: OFF. INTEREST RATE SIGNAL: OFF.
Keep up-to-date during the week at Twitter and StockTwits (links below), where a combined 26,202 people are joining in…
Twitter® Follow Me on Twitter®. Follow Me on StockTwits®.
SP500 Large Cap Index (click chart to enlarge; SPX, SPY):
Survey Says! Sentiment of individual investors (AAII.com) showed a Bull minus Bear percentage spread of -11.32% vs -7.16% last week. Once again, this is NOT what we expect to see at all time highs in the markets, at which point investors should be excited to own stocks, so despite any dip or correction that may occur, the Bull run is not over.
| Thurs. 12 am close to poll | Bulls 28.30% | Neutrals 32.08% | Bears 39.62% |
2. U.S. Small Caps: I re-entered a small cap position last week, a bit early in market timing terms. The small caps bounced off the top red line in the chart below. We will continue to look for opportunities to “buy low” as this Bull market continues.
Russell 2000 U.S. Small Cap Index (click chart to enlarge; IWM, RUT):
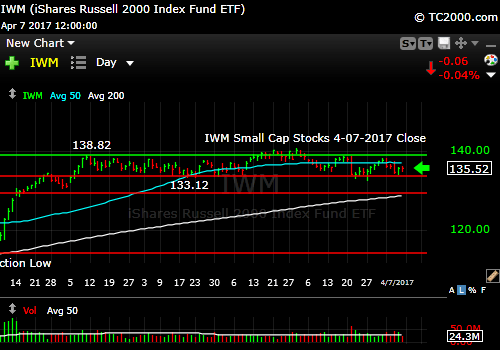
Small caps stuck too, more so than large caps.
3. Gold: Gold failed another market timing test of the February high. It will likely be “interest rates up and gold down” if Trump succeeds, but if he doesn’t OR if the Fed falls behind on inflation, gold can do well.
Gold ETF (click chart to enlarge the chart; GLD):
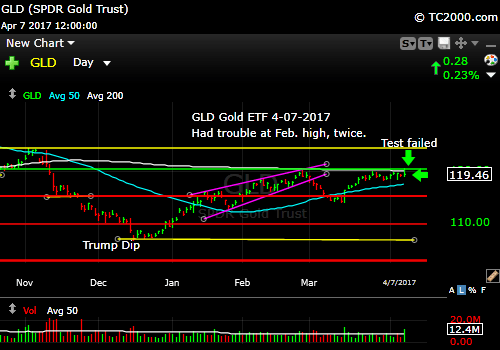
Gold fails another breakout.
4. U.S. 10 Year Treasury Note Yield (TNX): We are testing the lower white line in the market timing triangle yet again. The behavior of the 10 Year Treasury is probably our best “tell” on whether the market believes in “Trump Growth” or not. So far, it’s a big fat “maybe!” “No” would be a market timing move below the magenta line and “Yes” would be a move above the green line.
U.S. 10 Year Treasury Note Yield (click chart to enlarge; TNX, IEF, TYX,TLT,TBF):
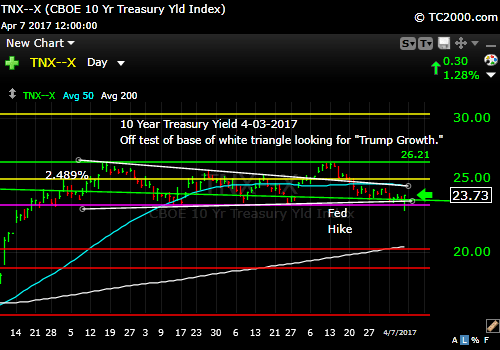
Rates also stuck in a range and the move out will be telling.
Thank you for reading. Would you please leave your comments below where it says “Leave a Reply”… or you should also feel free to ask a question…
Note: My monthly newsletter is now CLOSED to new subscriptions until Dec 2017. If all goes as planned, I will reopen the wait list for the end of December/January Issue in December.
Be sure to visit the website for more general investing knowledge at:
Standard Disclaimer: It’s your money and your decision as to how to invest it.
I thank Worden Brothers for the charting system I use to post these charts. If you want to know more about the charting system I use every day, go to my “Other Resources” page here: Other Resources It makes it much easier to follow along with me if you can see the charts and manipulate them on your own computer. It’s a great investment to have an excellent charting system. Check it out with a free trial at the link above.
Copyright © 2017 By Wall Street Sun and Storm Report, LLC All rights reserved.
